 |
 |
|
|
Home | 500 YouTube Videos, 25 topics in 2 parts | Video page Cancer to last topic science | VIDEOS YouTube on Economic-political Issues | Documentaries, Most view on YouTube, What I've learned | Concise: Diets, health, weight, insulin resistance, and type 2 diabetes | Part 1: Cardiovascular disease causes | Part 2: CVD Myths: Fats, sugars, cholesterol, and Statins id2.html | Part 3:: Carbohydrates: types, tables, role in NAFLD & MeS | Part 4 Fats role in CVD | Rancid Polyunsaturated and Trans-fats are Bad | Part 5: Healthful Lifestyle, Diet, Supplements, & Drugs | Part 6: Ill-health pandemic: conditons, causes, and dietary fixes | Atkins Low Carb Diet with modifications | Diabetes meds, bad medicines | Evidence for Alternate Day Fasting--Cures diabetes | Terms used in dietary articles | Pharma's tobacco science, diet, Inuslin Resistance, diabetes | Best Healthful Supplement for seniors | Fasting cures type 2 diabetes
|
|
|
|
Recommended Healthful
|
|
Part 3:: Carbohydrates: types, tables, role in NAFLD & MeS
|
|
|
|
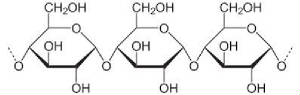
| 3 glucose joined, starches are thousand long |
|
| broken down in the stomach to individual glucose molecules |
Modification (3-22-22): If
your weight loss greatly diminishes, usually around 2-months, cut backn on net
carbs (fiber). The gut bacteria--like
with a cow--metabolize the fiber extracellularly (outside the cell) and about
60% of the digested fiber (glucose) will be absorbed by the intestines, the
remaining by the bacteria. With lots of
fiber the insulin level could rise, then the fat tissue hormone leptin will in
about 2 months lower metabolism and increase hunger. Insulin besides regulating
uptake of glucose
from the blood, the conversion of fatty acids to the storage form of
triglycerides, it also regulates leptin, the leptin that increases appetite and
diminishes metabolism. Thus, if you
metabolize 2,500 calories a day, metabolism will slow to 2,000 calories a
day.
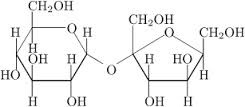
| SUCROSE-Table sugar-glucose and fructose |
|
| converted in the stomach to the individual sugar molecules |
Part 3: Carbohydrates: types, tables,
role in MeS /rh/id3.html (8/13/15)
The
first side of the healthy-diet coin is to know what to avoid (foods which cause
oxidative damage, glycation, insulin
resistance, fatty liver disease, metabolic syndrome, and atherogenesis)?
In exposing the cholesterol and the fat myths, you will find that dietary and serum cholesterol
is not a causal factor for cardiovascular disease (CVD) nor saturated fats,
but rather that pathogens in the artery walls is the main cause, and that trans-fats
and polyunsaturated fats promote cardiovascular disease (CVD). Also promoting[1] CVD is the combination of quantity of carbs plus sugars. Special
mention in the class of villains is fructose,
one half of table sugar, sucrose, it
starts the process by damaging the liver, which leads to insulin resistance
(IR) a condition of diminished response by fat and muscle cells to insulin
and thus elevated blood (serum) glucose which in response elevates insulin. Slowly with a high carbs diet IR develops into metabolic syndrome,[2]
(MeS), which is a family of
conditions that includes, obesity, type-2 diabetes (T2D) atherosclerosis (AS)
and CVD.
Fructose is metabolized only in the liver
where it is turned into fat, as the fat accumulates in hepatic (liver) cells
and insulin resistance in the liver develops.
Fructose also promotes in the brain sugar addiction. Over the decades the effects from the liver
damage is exacerbated by a high carb diet that causes high serum insulin. Insulin tells the body to store fat and burn
glucose (carbs), which when chronic causes weight gain. Muscle and fat cells (myocytes and adipocytes)
become gradually resistant to the high insulin, thereby requiring even more
insulin to lower serum glucose. The
high
insulin high glucose compromises immune
functions thereby promoting the development AS—the cause of hypertension
and myocardial infarction (MI)—heart
attack.
In time instead of producing even more insulin, the beta cells in
the pancreas produce less, and with this decline T2D develops which is treated with drugs. At this
point the patient has developed MeS. The recommended low in fat diet entails a high-carb diet to supply ATP
that was once derived burning fats. ATP
is the energy molecule used by the body.
This is why the Western diet with low-fat increases the risk for CVD, and causes weight gain by affects upon
the body’s fat-regulatory system (a topic developed at part 8). Bodily systems are not simple in the body; if
you wish an answer without the details go to diet. All of
these assertions above are developed in length below.
Basics common sugars: glucose, fructose, sucrose, galactose,
starches, glycogen, and ATP. Carbohydrates (saccharides)
are divided into
chemical groups based on the number of 6-carbon sugar molecules mono, di and polysaccharides. “Glucose
[a monosaccharide] is a primary food source of energy for the body cells—with a
few exceptions. [Fatty acids, proteins
(amino acids), galactose, and fructose are the other primary sources of energy
which are converted to glucose in the energy producing (ATP) Krebs cycle (also
called citric acid cycle)]. Glucose
is transported from the intestines or liver to body cells via the
bloodstream, and is made available for cell absorption via the hormone insulin,
produced by the body primarily in the pancreas. The body's homeostatic mechanism keeps blood
glucose levels within a
narrow range. It is composed of
several
interacting systems, of which hormone regulation is the most important.
Insulin decreases blood glucose.
If blood sugar levels remain too high the
body suppresses appetite over the short term.
Long-term
hyperglycemia causes many health
problems including heart disease, eye, kidney, and nerve damage [through the
process of glycation]” Wiki. Glucose
creates alertness through increase in level of norepinephrine—a reinforcer. “Glucose intake was found to
significantly increase plasma NE levels. In contrast, protein and fat intake
was found to have no effect” Wiki, and, 1981. This mechanism operates
less efficiently in the obese, thus requiring great consumption of glucose for
the response--1983. As Dr. Lustig observed,
obese children have a much lower response to glucose in soda.
Glycogen is the
storage form of glucose. It
is stored in the liver and muscles--total amount under 1 lb. It functions as a
quick source for production of ATP (energy).
Glycogen is a multi-branched glucose polysaccharide of glucose and is
analogous to starch a glucose
polymer in plants. Because of a 6 fold
greater bulk than fat per unit of ATP energy derived, it is storage is
limited. However is it a quickly
available reserve, of which up to 2 lbs. is stored. “Starch or amylum is a carbohydrate consisting of a large number of glucose units joined by glycosidic bonds. This polysaccharide is produced by most green plants as an energy store. It is the most common
carbohydrate in human diets and is contained in large amounts in such staple foods as potatoes, wheat, maize (corn), rice, and cassava”
Wiki. Fructose
(fruit sugar) stimulates only 1/5th the
product of insulin that glucose dose,[3]
and its blood serum level is not subject
to insulin control and thus remains higher longer when compared to a like
amount of glucose, at. This longer serum clearance results further
increase insulin response. “Fructose
given alone increased the blood glucose almost as much as a similar amount of
glucose (78% of the glucose-alone area)” Wiki. The
catabolism of
fructose (fructolysis)
is different from glycolysis, though it can enter into the pathway that
yields
glycogen. Fructose is 70% sweeter than glucose, thus
driving its commercial use, and it costs less than sucrose. A very important point, missed by most, is that
the regulation of food consumption, fructose has a lower satiety rating.[4] Sucrose
(table sugar) is a disaccharide
consisting of
glucose and fructose, and is readily hydrolyzed in the digestive system prior
to absorption into a molecule of glucose and fructose. It is found in plants, and is commercially
concentrated from sugar beets and sugar cane and used as molasses and table
sugar. In
2010 US sugar added
consumption averaged yearly 158 lbs. per person. Starches consist of multiple long chains of
glucose. Galactose is a monosaccharide found in the
milk disaccharide
lactose, which in metabolism is
converted to glucose. Moreover its
main dietary source milk sugar is lactose a disaccharide consisting of glucose
and galactose. Thus the For most people
it is a minor carbohydrate in diet. High
fructose corn sweetener consists of 43%
glucose and 55% fructose. “Catabolism
of
carbohydrates and fats yield Adenosine triphosphate (ATP) the principle energy source, often called the
“molecular currency of intercellular transfer.
It is recycled (reduced then oxidized) at such a high rate that a 150
lb. person will use his ½ lb. supply 300 times in 1 day” Wiki.
Glycation
Exogenous and Endogenous: glycation
consists of the covalent bonding of a protein or lipid (fat) molecule with a
sugar molecule, most commonly fructose and glucose which are reducing
molecules. Glycation inside the
body is
endogenous, and outside the body is exogenous.
Endogenous glycation is in most cases the major contributing factor for
age related diseases. This
topic is
developed in the section on fructose, which is over 10 times more reactive than
glucose. Exogenous is dietary glycation. Advanced
Glycation End-products (AEGs) are formed when sugars are cooked with
proteins and fats at a temperature over 120°C (249°F), but lower temperatures with longer cooking
times also promote their formation. “These compounds are absorbed by the body during
digestion with about 10% efficiency.[citation
needed] Browning reactions (usually Maillard type reactions) are
evidence of pre-formed glycations. Indeed, sugar is often added to products
such asfrench fries and baked goods to
enhance browning.[citation
needed] Glycation may also contribute to the formation
of acrylamide,[2] a potential carcinogen, during cooking. Until
recently, it was thought
that exogenous glycations and AGEs were negligible contributors to inflammation
and disease states, but recent work
has shown that they are
important.[3]
Food manufacturers have added AGEs to foods, especially in the last 50
years, as flavor enhancers and colorants to improve appearance.[4] Foods with
significant browning, caramelization, or directly added preformed AGEs can be
high in these compounds.[citation
needed] A very partial listing of foods with very high
exogenous AGEs includes donuts, barbecued meats, cake, and dark colored soda
pop.[5]”
Wiki Sugars (especially fructose) and starches
pose significant health risks which make a saturated and monounsaturated fats a
safer food source for energy—see Fats.
Sugar
Alcohols (Polyol)
A sugar
alcohol is a kind of alcohol prepared from sugar.[1] These organic compounds are a class of polyols, also called polyhydric
alcohol, polyalcohol,
or glycitol. They are
white, water-soluble solids that occur naturally and are used widely in the
food industry as thickeners and sweeteners. In commercial foodstuffs, sugar
alcohols are commonly used in place of table sugar (sucrose), often in
combination with high intensity artificial
sweeteners to counter the low
sweetness. Unlike sugars, sugar alcohols do not contribute to the formation of
tooth cavities. Sugar alcohols have the
general formula HOCH2(CHOH)nCH2OH.
In contrast, sugars have two fewer hydrogen atoms. Sugar alcohols occur
naturally and at one time, mannitol was obtained from natural sources. Today,
they are often obtained by hydrogenation of sugars, using Raney nickel catalysts. Of these, xylitol is perhaps the most popular due to its similarity to sucrose in visual
appearance and sweetness [of which there are 19 listed in Wikipedia].
As a
group, sugar alcohols are not as sweet as sucrose, and they have less food energy than sucrose. Their flavor is like sucrose, and they can be used to mask
the unpleasant aftertastes of some high intensity sweeteners
and some sugar alcohols can produce a
noticeable cooling sensation in the mouth when highly concentrated, for
instance in sugar-free hard
candy or chewing gum. Sugar alcohols are usually
incompletely absorbed into the blood stream from the small intestines which generally results in a smaller change in blood glucose than "regular" sugar (sucrose). This property
makes them popular sweeteners among diabetics and people on low-carbohydrate
diets.
Wiki. These sweeteners have minor affect if any
upon insulin index and little upon glucose index—1997. There is some evidence
that their effect upon
appetite regulation could be comparable to that of sucrose. Unfortunate it is not in the interest of
corporations to do studies to expose side effects or other effects that would
adversely affect sales. Given unknown
health risks moderation in use is advisable.
Hormone weight regulatory system: ghrelin and
leptin, insulin and Glucagon systems
Ghrelin (pr. GREL-in), the "hunger hormone",
is a peptide produced by ghrelin cells in the gastrointestinal tract, which functions as a neuropeptide in the central nervous system. Beyond regulating hunger, ghrelin also
plays a significant role in regulating the distribution and
rate of use of energy…. The receptor for
ghrelin is found on the same cells in the brain as the receptor for leptin, the satiety hormone that has opposite effects
from ghrelin…. Injections of ghrelin in both humans
and rats have been shown to increase food intake in a dose-dependent
manner. Studies have shown that
ghrelin
levels are negatively correlated with weight. This data suggests that ghrelin
functions as an adiposity signal, a messenger between the body's energy stores
and the brain…. When a person loses weight their ghrelin levels increase, which
causes increased food consumption and weight gain. On the other hand, when a
person gains weight, ghrelin levels drop, leading to a decrease in food
consumption and weight loss. This suggests that ghrelin acts as a body weight
regulator, Ghrelin acts on its receptor in the
pancreas to inhibit glucose-stimulated insulin secretion” Wiki.
The appetite-hormone system is complex, and
certain conditions don’t follow the simple hunger-serum level paradigm. The
same for the other hormone is the fat, glucose, appetite, activity regulatory
processes.
Leptin (Greek λεπτός (leptos)
meaning
"thin") is a 16-kDaadipokine that plays a key role in
regulating energy intake and expenditure, including appetite and hunger, metabolism, and
behavior. It
is one of the most important adipose-derived
hormones.
Leptin functions by
binding to the leptin
receptor. The Ob(Lep) gene (Ob for obese, Lep
for leptin) is located on chromosome
7 in humans. Human leptin is a
protein of 167 amino acids… the level of
circulating leptin is proportional to the total amount of fat in the body.
This hormone circulates in blood and acts on
the hypothalamus to regulate food intake and energy expenditure. When fat mass
falls, plasma leptin levels fall stimulating appetite and suppressing energy
expenditure until fat mass is restored. When fat mass increases, leptin levels
increase, suppressing appetite until weight is lost. Leptin acts on receptors in the
hypothalamus of the brain, where it inhibits
appetite. This
appetite inhibition is long-term, in contrast to the rapid inhibition of eating
by cholecystokinin (CCK) and the slower
suppression of hunger between meals mediated by PYY3-36.
Leptin
signals the brain that the body has had enough to eat, producing a feeling
of satiety. In humans, low
circulating plasma leptin has been associated with cognitive changes associated
with anorexia, depression,
HIV, and the development of Alzheimer's disease. Leptin modulates the immune response to
atherosclerosis, of which obesity is a predisposing factor” Wiki. That
fructose bypasses the leptin-insulin regulatory system is a secondary behind
elevated insulin as a cause for the rise in obesity since 1970.
It also causes a rise in ghrelin which is the
slip-side of leptin, it increase appetite.
Insulin and glucagon
in glucose regulation:
The Isle of Langerhans in the pancreas produces
the hormones glucagon, insulin and amylin, somatostatin, and pancreatic
polypetides, all of which play a role in the regulation of blood
glucose-glycogen levels. Glucagon and insulin
play major roles in the regulation of cellular glucose-glycogen levels.
“Glucagon
raises blood glucose levels by promoting
gluconeogensis and glycogenolysis. Its effect
is opposite that of insulin, which lowers blood
glucose levels. The pancreas
releases glucagon when blood sugar (glucose) levels fall too low. Glucagon causes
the liver to convert stored
glycogen polymers into glucose, which is released into the bloodstream. As these stores become
depleted, glucagon then encourages the liver and kidney to synthesize
additional glucose by gluconeogenesis. Glucagon
turns off glycolysis in the liver [the production of ATP], causing
glycolytic intermediates to be shuttled to gluconeogenesis. High blood glucose levels stimulate the
release of insulin” Wiki. Insulin
causes cells in the skeletal muscles, and fat tissue to absorb glucose from the blood. Insulin stops the use
of fat as an energy
source by inhibiting the release of glucagon. Insulin is provided within
the
body in a constant proportion to remove excess glucose from the blood, which
otherwise would be toxic. When blood glucose levels fall below a certain level,
the body begins to use stored sugar as an energy source through glycogenolysis, which breaks down the glycogen stored in the
liver and muscles into glucose, which can then be utilized as an energy source.[5] When control of insulin levels fails, diabetes mellitus can result.
Patients with type 2 diabetes are insulin resistant. Over 40% of those with Type 2 diabetes
require insulin as part of their diabetes management plan” Wiki. “Insulin causes esterification of fatty acids–-forces
adipose tissue to make
fats (i.e., triglycerides) from fatty acid esters and thereby forces its
storage and its lack the reverse” Wiki.
Insulin resistance
(IR): Insulin resistance promotes glycation
through the higher level of plasma (blood) sugars for a longer period of
time. Glycation2 damages LDL
and thus when in excess causes the formation of plaque. “Higher concentrations of glycated LDL are
present in diabetic than non-diabetic individuals, but even in the latter,
there is generally more circulated glycated than oxidatively modified LDL…
[glycation[6]
damaged LDL] prevents LDL receptor-mediated uptake and promotes macrophage
scavenger receptor uptake. The recognition that LDL glycation is at least as
important as oxidation in atherogenesis… ” 2008 journal, and. This increase in damaged LDL is
associated (but not causal) with
a lower
active transport of LDL into cells to fulfill the bodily needs and thereby causes a higher signaling to the liver for
the production of more LDL. Thus
higher level of blood LDL is associated with IR. IR is a cause of AS by
promoting damaged LDL through high blood sugar and thus glycation of LDL.
“Leptin resistance can be triggered in
rats by ad libitum [at ones pleasure]
consumption of energy-dense, highly palatable foods over a period of several
days…. IR stimulates the formation
of new fatty tissue and accelerates weight gain. Obesity should therefore not be regarded as a
pathology or disease, but rather as the normal, physiologic response to
sustained caloric surplus… Sedentary
lifestyle increases the likelihood of development of insulin resistance. It's been estimated that each 500 kcal/week increment in
physical activity related energy expenditure reduces the lifetime risk of type
2 diabetes by 6%. A
different study found that vigorous exercise at least
once a week reduced the risk of type 2 diabetes in women by 33%” Wiki. Exercise
lowers blood sugar.
In Science
2003 a
study confirmed an age
association with IR in that
there is among the elderly a ~40% reduction in oxidative and phosphorylation
activity in the mitochondria; viz., the person with IR, their mitochondria clears glucose at a much lower rate.
High
sugar diet: A chain of
interconnected conditions arise from decades-long elevation in blood glucose
and fructose. Metabolic syndrome,
insulin resistance, obesity, and fatty live are results of sugar-initiated
damage to the liver. The liver synthesizes
glucose from certain amino acids, lactate, and glycerol; breaks down g1lycogen
into glucose, and convert glucose to glycogen which it can store.
Sugars cause oxidative and glycation damage
to the liver which diminish its functions.
It appears that both glucose and fructose contribute to the damage, with
probably fructose being the more important of the two.
In
Hippocampus 2008: “Here, we used
functional and structural assays to characterize the effects of excessive
caloric intake on the hippocampus, a brain region important for learning and
memory. We conclude that a high-calorie diet
reduces hippocampal synaptic plasticity and impairs cognitive function,
possibly through BDNF-mediated effects on dendritic spines.”
High
sugar diet causing fatty liver and metabolic syndrome is supported both by
population studies and laboratory research (topics developed below).
High sugar diet is linked to tooth decay
insulin intolerance, gout obesity, diabetes, atherosclerosis, CVD,
Alzheimer’s disease, cognitive
decline, and many other age-related chronic conditions.
Fructose is 7.5 fold more reactive that
glucose in pathogenic glycation, (actually 15 fold because of slower clearance),
thus its role in chronic diseases is much greater than glucose.
Fructose, the
differences from glucose: “Unlike glucose,
which is metabolized widely in the body, fructose is metabolized almost
completely in the liver in humans, where it is directed toward replenishment of
liver glycogen and triglyceride synthesis.
Fructose is also not
metabolized in insulin-sensitive peripheral tissues. Fructose is selectively
taken up and almost completely metabolized by liver hepatocytes, while much
of dietary glucose passes through
the liver where it is metabolized in skeletal muscle to CO2, H2O
and ATP”
Wiki.
“Fructose is often recommended for diabetics
because it does not trigger the production of insulin by pancreatic β cells, probably because β cells have low levels of GLUT5
[transport system
into pancreas] although its net effect is debated. Fructose has a very
low glycemic index of 19 ± 2, compared with 100 for glucose and 68
± 5 for sucrose [discussed at end of this article]. Fructose is also seventy-three percent
sweeter than sucrose. Compared with consumption of high glucose beverages,
drinking
high-fructose beverages with meals results in lower circulating insulin and leptin levels, and higher ghrelin levels after the meal. Since
leptin and insulin decrease appetite and ghrelin increases appetite, some
researchers suspect that eating large amounts of fructose increases the
likelihood of weight gain” Wiki, this calls to question the advice for
diabetics on the safety of fructose as it promotes obesity a key health issue
for three-fourths of those with type 2 diabetes, and through a 15 fold higher
rate of glycation per bolus. However
there
are 2 metabolic pathways in fructolysis: one produces triglycerides from DHAP and
glyceraldehyde 3- phosphate; the other converts DHAP into glucose and
glycogen. “Since fructose
consumption has been hypothesized to be a cause of insulin
resistance, obesity, …
and, leading to metabolic
syndrome. In preliminary research, fructose consumption
was correlated
with obesity. A study in
mice showed that a high fructose intake may increase adiposity. While a few
other tissues (e.g., sperm cells and some intestinal cells) do use fructose
directly, fructose is metabolized primarily in the liver. Since leptin and insulin decrease appetite
and ghrelin increases appetite, some researchers suspect that eating large
amounts of fructose increases the likelihood of weight gain. A preliminary human study indicated that
fructose may not influence
metabolic activity or blood flow in brain regions regulating satiety ("fullness"), and so may promote overeating. Excessive fructose consumption may contribute to the development
of non-alcoholic
fatty liver disease [describe
below}” Wiki.
Typical
findings
for effects of high
fructose diet include: “Fructose is more lipogenic[fat producing] than
glucose or starches, and usually causes greater elevations in triglycerides and
sometimes cholesterol than other carbohydrates. Dietary fructose has resulted in increases
in blood pressure, uric acid, and lactic acid. People who are hypertensive, hyperinsulinemic,
hypertriglyceridemic[7],
non-insulin-dependent diabetes, or postmenopausal, they are
more susceptible to these adverse effects of dietary fructose
than healthy young subjects.” In
Fructose,
weight gain and insulin resistance syndrome, 2002
journal article states: “Because
leptin production is regulated by
insulin responses to meals [and fructose doesn’t stimulate insulin production],
fructose consumption also reduces circulating leptin concentrations. The
combined effects of lowered circulating leptin and insulin in individuals who
consume diets that are high in dietary fructose could therefore increase the
likelihood of weight gain and its associated metabolic sequelae [injury].” Corresponding
with the rise in CVD and obesity
has
been fructose’s dietary increase. USDA chart: The
per-capita yearly consumption of sweeteners was 109 lbs. in 1950 and 152 lbs.
in 2000. The USDA states: “The food consumption in 1970 was 2275 calories
and in 2000 was 2,750 calories per person per day, 475 calories above the 1970
level.” Though
both glucose and fructose are about equally efficient
at producing ATP (the body’s energy source), fructose rate of glycation is 7.5
fold greater [actually 15 fold because of slower clearance than glucose].
In addition fructose has a greater role than
glucose in obesity, IR, MeS, fatty
liver disease, and numerous chronic conditions.
Though I have relied upon Wikipedia as a source, those with a financial
interest spin their articles; thus other sources than the fructose article to
place fructose in the spot light as the leading cause for the plethora of
conditions that are currently epidemic.
Sugar
addiction: “The hedonic
pathway comprises a neural
conduit between two brain areas: the
ventral tegmental area bv (VTA) and the nucleus accumbens (NA also known as the reward
center),…
Pleasure occurs when the VTA signals the NA to release dopamine, a
neurotransmitter…. When the released dopamine binds to its specific dopamine D3
receptor in the NA, the sense of pleasure is experienced. [Sugars] are also key players in the hedonic
pathway, modulating reward to response to meals. In normal circumstances, after you’ve eaten a
sufficient amount, leptin sends a signal to the VTA to suppress the release of
dopamine, thereby reducing the reward of food…. If you feed a rodent a
palatable food (e.g., a high-fat, high-sugar food such as cookie dough), the
animal experiences reward because dopamine is released from VTA and binds to D3
receptor in the NA…. Dopamine stimulation in the NA reinforces the intake of
drugs or alcohol and also of food…. After you’ve eaten a sufficient amount,
leptin sends a signal to the VTA to suppress the release of dopamine, thereby
reducing the reward of food. That’s
what
obesity is: leptin resistance. What about insulin, leptin’s accomplice? Normally, people are sufficiently sensitive
to insulin. Insulin’s job
is to clear
dopamine from the synapses…. Thus the rise in insulin that occurs during a meal
blunts the reward of further food intake.
This acts as a servo-mechanism built into the hedonic pathway to prevent
overfeeding. Insulin resistance
leads to
leptin resistance in the VTA, contributing to increased caloric intake by
preventing dopamine clearance from the NA.
Increase pleasure is then derived from food when energy stores are
full…. Thus, the combination of high fat along with high sugar is likely to be
more addictive than high fat alone. All
the criteria for sugar addiction have been demonstrated in rodent models.
Evolutionary, sweetness was the signal to
our ancestors that something was safe to eat“, Prof. Robert Lustig, Fat
Chance 2013, p 50-56. If you doubt the sugar addiction theory,
try
cutting your sugar intake to 24 grams a day (6 teaspoons). Use the food labels to determine sugar
content and USDA Handbook for the bulk foods (mainly fruits, vegetables).
I tried it, and though fairly good at
eliminating sugar added products, I keep nibbling on fruits.
I have eliminated the sugar added foods at
the source, the grocery store. They
simply aren’t getting replaced, and the worse of them have been trashed. Secondly observe the behavior of children
between the ages of 3 and 6, most crave sugar added products, and let their
parents know it. Loaded on sugar
they
become hyperactive. Another
mechanism for this addiction is through the stimulation caused by the
neurotransmitter norepinephrine. Glucose creates alertness
through increase in
level of norepinephrine—a reinforcer. “Glucose intake
was found to
significantly increase plasma NE levels. In contrast, protein and fat intake
was found to have no effect” Wiki, and, 1981. This mechanism operates
less efficiently in the obese, thus requiring great consumption of glucose for
the response--1983. As Dr. Lustig observed,
obese children have a much lower response to glucose in soda.
Sugar & refined carbs are highly
addictive through multiple mechanisms.
Stress,
Cortisol and Food Comfort:
“It is released
in response to stress and a low level of blood glucose. Its primary
functions are to increase blood sugar through gluconeogenesis, suppress the immune system, and aid the metabolism of fat, protein, and carbohydrate”
Wiki. “The
relationship between stress and obesity, and metabolic disease begins with the
hormone cortisol, which is released by your adrenal glands” Lustig supra
65. The complexity of the functions
of
cortisol is sufficient that I discount the 4 examples supplied by Prof. Lustig
as to cortisol’s role. There
are
compelling counter examples, including the British Whitehall Study.
Those at the top of the work pyramid had the
lowest CVD, even after controlling
for contravening factors. Presumable
they had the most stress—a point Lustig fails to make.
“Stress” is a nebulous concept that should be
left out of the realm of science (though not psychology). Stress might promote weight gain in some
circumstances through increased sloth, and for others through greater energy
expenditure (reduce sleep, greater alertness and activity) reduce it for others
in real-world situations—quite different than contrived laboratory situations
with rats. My own stress experience
supports weight reduction through increased activity, less eating, and less
dining to relieve boredom.
As for CVD the
relationship of cortisol is muddled. The research is funded by pharma
who is
looking for another reason to put people on statins and tranquilizers. The
studies of cortisol on the effects of those with the highest levels are too
short-term; and their results are inconsistent.
Studies on rats also are controversial.
A conclusion on cortisol as a cause for CVD and obesity needs better science.
I suspect that by adding another cause which pharma
uses it to explain to skeptics why hypercholesterolemia is only at best very
weakly associated with CVD. And
soon they will be marketing drugs to lower
cortisol.
Metabolic
syndrome and sugar: “metabolic syndrome is a disorder of energy utilization and storage, diagnosed
by a co-occurrence of three out of
five of the following medical conditions: abdominal (central) obesity, elevated
blood pressure, elevated fasting plasma glucose,…. Metabolic syndrome increases
the risk of developing cardiovascular
disease, particularly heart failure, and diabetes. Some studies have shown the prevalence in the USA to be an estimated 34% of the adult
population, and the prevalence increases with age” Wiki. “A randomized,
controlled trial of 74 adult men who were
administered 200 g fructose daily for 2 weeks with or
without allopurinol. Primary measures included changes in ambulatory blood
pressure, fasting lipids, glucose and insulin, homeostatic model assessment
(HOMA) index, body mass index and criteria for metabolic syndrome… High doses of fructose raise the blood
pressure and cause the features of metabolic syndrome” at
journal. Sugar,
especially fructose diet has been demonstrated in
both
human and animal experiments to
cause metabolic syndrome—estrogen has been shown
to be
protective.[8] Metabolic syndrome affects 44% of the
U.S.
population older than age 50” Wiki. Note
this is inflated by including dyslipidemia in the list of conditions that
qualify for the condition—another way for pharma to sell Statins and Part
2 on the cholesterol myth. Thus one more drug, a statin, is added to
chemical soup: one for diabetes,
the 3
for hypertension, one for weight loss, and a protein pump inhibitor to reduce
the risk of an ulcer from this polypharmacy.
The benefits of treating hypertension go to pharma, not the
patient—except for malignant
hypertension.
And it gets worse, since pharma’s drugs don’t fix the problem, which isn’t
hypertension, but atherosclerosis.
Hypertension is to atherosclerosis, as fever is to bronchitis; both are
signs of an illness. And it get
even
worse, over 80% of MI, result from
young-unstable plaque, which occludes blood vessels under 20% and isn’t a cause
of hypertension. The cause of
hypertension is the mature, encapsulated hard plaque doesn’t leak. This
explains why lowering blood pressure doesn’t work. Thus when Cochrane Review looked at pharma’s
better studies,
they found they weren’t worth the side
effects—but pharma is very good at marketing.
The effective treatment for metabolic syndrome is diet and lifestyle
changes.
Fructose
and
non-alcoholic fatty liver disease (NAFLD): Fructose brings about NAFLD
in the same way as alcohol: ethanol is metabolized in the liver and used
in the production of fatty acids, the same from fructose.[9] Liver cells as they accumulate fat become
deformed, the degree of which affects performance. Moreover, glycation in the liver causes
additional damage. This condition
can
progress to a point where it shows up on liver
function tests
in “75%
of obese people. “Fatty livers occur in 33% of
European-Americans, 45% of Hispanic-Americans, and 24% of African-Americans” Wiki. “Non-alcoholic fatty liver disease (NAFLD) is the term for a wide range of
conditions caused by a build-up of fat within the liver cells. It is
usually seen in people who are overweight or obese. NAFLD is related to insulin resistance and the metabolic syndrome and may respond to exercise, diet
change, and weight loss. It is a
spectrum disease, and at the low end of NAFLD,
few have symptoms. Some patients
complain of fatigue and malaise. A healthy liver should contain little or no fat. Most people with NAFLD only carry small amounts of fat
in their liver, which doesn't usually cause any symptoms. This early form of
the disease is known as simple fatty liver, or steatosis. Simple fatty liver is very common in the
UK, reflecting the number of people who are obese or overweight.
It is one of the most common forms of
liver disease, with an estimated 25-30% people in the UK having early
forms of NAFLD” NHS. “It is
difficult to distinguish alcoholic FLD
from nonalcoholic FLD, and both show micro-vesicular and macro-vesicular
fatty changes at different stages. Fatty
change represents the intra-cytoplasmatic accumulation of
triglycerides (neutral fats). At the beginning, the hepatocytes present small
fat vacuoles (liposomes) around the nucleus (micro-vesicular fatty
change). In this stage, liver cells are filled with multiple fat droplets that
do not displace the centrally located nucleus. In the late stages, the size of
the vacuoles increases, pushing the nucleus to the periphery of the cell,
giving characteristic signet
ring appearance (macro-vesicular
fatty change). Large vacuoles may coalesce and produce fatty cysts,
which are irreversible lesions. Defects
in fatty acid metabolism are responsible for pathogenesis of FLD, which may be due to imbalance in energy consumption and its
combustion, resulting in lipid storage,
or can be a consequence of peripheral
resistance to insulin, whereby the
transport of fatty acids from adipose tissue to the liver is increased. Impairment or inhibition
of receptor
molecules (PPAR-α, PPAR-γ and SREBP1)
that control the enzymes responsible for the oxidation and synthesis of fatty
acids appears to contribute to fat accumulation. On the other hand,
nonalcoholic FLD may begin as excess of unmetabolised energy
in liver cells. Hepatic steatosis
[fat build up in liver] is
considered reversible and to some extent non-progressive if the
underlying cause is reduced or removed. FLD is observed in up to 75% of obese people, 35%
of whom progressing to NAFLD” Wiki. A
high fructose diet affects metabolism in the liver through NAFLD that promotes insulin resistance throughout the body.
“The degradation of the metabolic processes in
the liver entails
a decrease in energy and subsequent related emotional problems such as
depression. The close parallel in
fructose metabolism results in metabolic consequences which resemble those from
alcoholism. Given the many functions of
the liver, a healthy liver
has numerous varied benefits.” In
Gastroenterology “soft
drink consumption is the most common risk factor for fatty infiltration of the
liver in patients without classic risk factors” like finding, and. The role of sugar is found in hundreds of
journal article on NAFLD.
NAFLD its development:
NAFLD
requires both high carbs and high fructose.
That it takes both is confirmed by Japanese and other population that eat
a traditionally high-carb diet, but with very low sugar—for the Japanese 15
grams per day. These populations lack
the comorbidity associated with MeS.
Fructose is metabolized only in the
liver where it is converted to fat.
Insulin tells the body to store
fat and burn glucose. If in the long term too much fat is
made, and there is high insulin due to glucose, it accumulates in the liver cells to cause non-alcoholic fatty liver disease (NAFLD).
This fat in cells reduces liver functions, as too does glycation by
fructose (describe above); both promote IR
in the liver—the first step in developing IR
in the rest of the body and MeS. Insulin
resistance in the liver entails also
elevated glucose because of a reduced production of glycogen by the liver. Insulin
resistance is where the normal level
of insulin fails to sufficiently lower serum glucose, and the pancreas thus
releases more insulin to obtain the fasting serum level of glucose. This
abnormally high level of insulin slowly
causes the body to store more than the normal level of fat. White adipose (fat)
tissue (the most common
kind) produces hormones which regulate the level of fat. With insulin resistance
this regulatory
system is reset to maintain the weight gain.
For dietary fix to NALFD and
obesity go to section 3 of link.
Role of glucose, fructose in
glycation and CVD and other conditions:
“Excess fructose consumption has been
hypothesized to be a cause of insulin resistance, obesity, elevated LDL cholesterol and triglycerides,
leading to metabolic syndrome [and
NAFLD].
In preliminary research,
fructose consumption was correlated with obesity. A study in mice showed
that a high fructose intake may increase adiposity [body fat]” Wiki. “Why glucose — and not
another monosaccharide such as fructose — is so widely used in
organisms is not clearly understood. One reason might be that glucose has a
lower tendency than other hexose sugars
to react non-specifically with the amino groups of proteins
[glycation]. This reaction - (glycation) -
reduces or destroys the function of many enzymes. The
low rate of glycation is due to glucose's preference for the less reactive
cyclic isomer.
Nevertheless, many of the long-term complications of diabetes (e.g., blindness, renal
failure, and peripheral neuropathy) are
probably due to the glycation of
proteins or lipids” Wiki. The standard theory is that the process which
causes other age related chronic conditions, glycation, is the main vector in atherogenesis:
“they
produce reactive chemicals that can oxidize small dense type-B LDL, and cause
in a variety of complex ways through the accumulation of glycation
end products (AGEs)
affect a number of cellular process of which some are atherogenic, and also
contribute significantly to the conditions associated with old age” (Mo. 2009).[10] The process centers around glycation, ”which is the result of typically covalent bonding
of a protein or lipid molecule with a sugar molecule,
such as fructose or glucose,
without the controlling action of an enzyme.
All blood sugars are reducing molecules.
Endogenous glycations
occur mainly in the bloodstream to a small proportion of the absorbed simple
sugars: glucose, fructose,
and galactose. It appears that fructose and galactose[11]
have approximately ten times the glycation activity of glucose, the primary body
fuel. Some glycations are benign,
but others are more reactive than the sugars they are derived from,
and are implicated in many age-related chronic diseases such as cardiovascular diseases (the endothelium, fibrinogen, and collagen are
damaged), Alzheimer's disease (amyloid proteins are
side-products of the
reactions progressing to AGEs), cancer (acrylamide and
other
side-products are released), peripheral
neuropathy (the myelin is
attacked), and other sensory
losses such as deafness (due to demyelination). This range of diseases is the result of the
very basic level at which [1] glycations
interfere with molecular and cellular functioning throughout the body and [2]
the release of highly oxidizing
side-products such as hydrogen peroxide. Long-lived cells (such as nerves and different types of brain
cell), long-lasting proteins (such as crystallins of the lens and cornea), and DNA may
accumulate substantial
damage over time. Cells such as the retina cells in the eyes, and beta
cells (insulin-producing) in the pancreas are also at high risk
of
damage. Damage by glycation causes stiffening of the collagen in the blood
vessel walls, leading to high blood pressure, especially in diabetes. Glycations also cause weakening of the collagen in the blood
vessel walls which may lead to micro- or macro-aneurisms; this may cause
strokes if in the brain” Wiki. (Note fructose only
modestly stimulates insulin production and thus its contribution in tables of
glycemic index, insulin index and glycemic load is small.)[12] Pharma has slipped in atherogenesis to
the
list of conditions in which glycation is a main causal force.
But there are critics and strong evidence
that the main culprit in atherogenesis
is pathogens living
in the artery walls that cause the immune response by leukocytes.
Microphages and macrophages within the artery
wall are responding to the presence of the pathogens, so too is the LDL.
Besides the function of transport of
triglycerides and cholesterol, LDL has a second function that of neutralizing toxins secreted by the
pathogens. LDL has been shown to
have
toxins from infection attach to it. The
putative key role of oxidized LDL
is
another part of pharma’s cholesterol myth. The
actual importance of glycation and
reactive oxygen species (ROS) has
been muddled by the cholesterol myth and the believers interpreting every bit
of evidence in atherogenesis as examples of that fits the cholesterol
myth. Pharma has framed the
dialogue on
atherogenesis, and the evidence for pathogen has been essentially ignored as
also the failure to find a strong relationship between elevated cholesterol and
ischemic events. The role of glycation and ROS is minor. Thus what is
an inflammatory response by the immune system is of the typical type, namely in
response to pathogens, not to ROS
that damage LDL as promoted by pharma. For
your acceptance of the infective-agent theory, you must examine the links
provided above and review the research. I
did this in the winter of 2014-15 and was convinced, and thus I had to revise
all of my earlier published materials on CVD
and diet. This is part of an all
too
common pattern of business using their tobacco science to frame the
discussion.
Corn syrup (glucose syrup) “is a food syrup, which
is made from the starch of corn and contains varying amounts
of maltose and higher oligosaccharides,
depending on the grade. Corn
syrup is distinct from high-fructose
corn syrup (HFCS),
which is manufactured from corn syrup by converting a large proportion of its glucose into fructose using the enzyme xylose
isomerase, thus producing
a sweeter compound due to higher levels of
fructose. [Unlike sucrose, HFCS is 2
monosaccharides, thus it is not hydrolyzed in the stomach.] A bushel (25 kg) of corn
will yield an average of 31.5 pounds (14.3 kg) of starch, which in turn
will yield about 33.3 pounds (15.1 kg) of syrup. Glucose syrup was the primary
corn sweetener in the United States prior to the
expanded use of high fructose
corn syrup production. HFCS
is a variant in which other enzymes are used to convert some of the glucose
into fructose. Corn
syrup is available as a retail product. The best-known brand in the U.S. is Karo”
Wiki. The causes for CVD & obesity epidemics rest with the food industry: they replaced
corn syrup with HFCS, increased the
amount of sugars in manufactured foods, changed dietary practices through a
huge advertising campaign, and promoted the low fat diet high carb diet with
the use of vegetable oils instead of saturated fats. Their lobbying and use of marketing science
resulted in the change in dietary recommendation established through the
McGovern United States Senate Select Committee on Nutrition and Human Needs,
also called the McGovern committee after its only chairperson. It met from 1968
to 1977 and issued in January 1977 ”a new set of nutritional guidelines for
Americans that sought to combat leading killer conditions such as heart
disease, certain cancers, stroke, high blood pressure, obesity, diabetes, and
atherosclerosis…. They suggested that Americans eat less fat, less cholesterol,
less refined and processed sugars, and more carbohydrates and fiber” Wiki. This led to the birth of the Western diet
with its disastrous health consequence.
Maltose, malt
sugar, “is a disaccharide formed from two units of glucose joined with an α(1→4) bond. Maltose
is the disaccharide produced when amylase breaks down starch. It
is found in germinating seeds such as barley as they break down their
starch stores to use for food. It is also produced when glucose is caramelized.
In humans, maltose is
broken down by the enzyme maltase so that there are two glucose molecules from
which the glucose metabolism obtains energy” Wiki. Since Maltose and Karo are without fructose, they
are the preferred sweeteners.
In summary:
Fructose because of its failure to stimulate
insulin-leptin brain control of appetite is the primary cause of obesity in
those on a high sugar diet. Fructose
because of its 10 fold greater rate of glycation causes more damage than
glucose. The increase in sugar in
the
diet has caused a rapid rise in the rate of diabetes, metabolic syndrome, fatty
liver, and insulin resistance. Given
that Oriental traditional diet is high in polished white rice and low in sugar
(15 gm/day, Japan) and various experiments upon the effect of high fructose
drinks, the evidence indicates that the combination of starches and sugars is
the main culprit in the obesity and CVD
dramatic increase. Japan’s
rate of
Alzheimer’s and CVD are about
one
third and obesity even less when compared to those who eat a carb-fructose rich
Western diet. Japan is first on
the
longevity list. Similar rates are
found
in those societies that eat a low sugar diet.
Strenuous exercise diminishes the effect of sugar overload by burning
off the excess glucose in the muscles.
Thus it would seem that a low sugar diet high starch diet would provide
a safer source of ATP (energy). But
one
of the indicators of metabolic syndrome is high blood glucose.
Could glucose play a greater role and are all
starches equal?
Paleolithic (hunter-gatherer)
diet. There is a chorus
of
critics of the western diet; they extol the Paleolithic diet (Stone Age, stone tools
and without metal), the prehistoric period from 2.6 million to 10,000 years ago
which is without processed grains, trans-fats, and the liberal consumption
of high sugar foods. “Modern humans
are
said to be maladapted to eating foods such as grain, legumes, and dairy, and in particular
the high-calorie processed foods that are a staple part of most modern diets. The evolutionary discordance hypothesis
states that ‘many chronic diseases and degenerative
conditions evident in modern Western populations have
arisen because of a mismatch between Stone Age genes and recently adopted lifestyles’” Wiki. Our Western diet is
violating our genetic heritage. Are
they
right? In Part
2 I laid to rest the misconceptions about the
Mediterranean diet, the same here for parts of the Paleolithic diet.
Though there are exceptions, what stated here
applies to the majority of Paleolithic societies. On the face of it, the argument is
flawed. Paleolithic humans, more
than
any other animal, have adopted to eating a wide variety of foods, just consider
the differences in diet of the Eskimo, the Yanomamo of the Amazon jungle, the
Lapps of northern Europe, the Polynesians Islanders[13],
and the Bush People of the Kalahari Desert.
The maladaptation argument is right only about high sugar diet, transfats,
and polyunsaturated fats, but not dairy, legumes, carbs, and grains.
What follows, I am relying upon Gary Taube, Why
We Get Fat, 164-168 and the article he relied upon the work of Cordan. Corban’s 2000 article analyzies the diet
analyzed the diet of 229 Paleolithic societies, short, long. High amounts of animal products were consumed
(73% > 50% of calories) which amounts at the high end to over 85% of their
calories from meat and fish. Only
14%
got more than 50% of their calories from plant foods. Fat averages over 40%, the Inuit 80%. To prevent health consequences such as gout
from high-protein diet, more fat is need for the liver to eliminate nitrogen as
urea (Cordan 689). Thus the fatty
portion of meat is prized. The caution
of critics concerning dairy again is without merit since several society such
as the Lapps of Scandinavia relied heavily upon dairy as did Mongolian and some
African tribes. It is further clouded
by
the fact that those Neolithic societies which practiced farming were equally
free of modern diseases associated with the Western diet. Wild sources of grain had small kernels, thus
few of these societies consumed grains, and those that did ground the kernel,
such as the Indians of central Mexico.
The main changes are the introduction in the Western diet of corn,
grains, potatoes, and sugar. Current
fruits have higher-sugar content than the wild varieties. The Western diet is unique with its recommended
15% of calories from protein, 33% from fat with 7% being saturated, and the
remainder from carbohydrates (USDA).
Beside the high carbs and sugars, the Western diet is high in unhealthful
fructose, omega-6 fatty acids, and other polyunsaturated fats subject to rancidification
(see Part
4). Native peoples consumed
mostly saturated fats, and moderate at most fructose. Food science supports the Paleolithic-Neolithic
diet.
Whole grain wheat compared to white flour.
Inositol
Upon inositol is
bonded to each OH group a phosphate (PO4) bonds with the removal of
the hydrogen to form phytic acid that
consists of 6 H2PO4
around a benzene core. The most
prominent
form of inositol, widely occurring in nature, is cis-1,2,3,5-trans-4,6-cyclohexanehexol,
or myo-inositol (former names meso-inositol or i-inositol).
Inositol is a carbohydrate, though not a classical
sugar. Its taste
has been assayed at half the sweetness of table sugar (sucrose). It plays an important role as the structural
basis for a number of secondary messengers in eukaryotic cells, and was once
considered a B vitamin, but since it is synthesized from glucose-6- phosphate
(G-6-P) in sufficient amounts, thus it is not an essential nutrient. Various
health benefits have been independently tested, including cancer when
administered with phytic acid.
Unfortunately pharma is not going to fund definitive studies. Myo-inositol is naturally present in beans,
grains, fruits, and nuts mostly in the unavailable phytate form rather than the
bioavailable lecithin form. Beans
and
grains, being nuts, they contain large amounts of phytic acid.
Since wheat is the main
source of starch in the Western diet, is
whole grain wheat superior to refined white flour? The affirmative answer has become a truism,
but white flour remains far more popular because it tastes better.
Since few people grind and make their own
breads, I will consider the commercial whole grain breads and brown
flour--using US regulations. The
major
issue with whole-wheat breads arises from phytic
acid[14], which prevents the
absorption of most of the micronutrients.
While epidemiological studies support benefits, there
are so many contravening variables that a biological mechanistic answer is
required. Whole grain wheat has 14% bran and 3% germ, thus only 83%
endosperm, while white refined flour is all endosperm. A number of nutrients are found in the germ:
“Whole-grain foods are rich sources of
antioxidants, including vitamins, trace minerals, phenolic acids, ligands, and
phytoestrogens. Vitamin E and selenium are particularly concentrated in whole
grains. Other trace minerals such as copper, zinc, and manganese are also found
in the outer layer of grains. In addition, phytic
acid, traditionally considered an
anti-nutrient, may also function as an antioxidant. In particular, phytic acid
has the ability to form
chelates with a variety of metals [prevents their absorption from foods], it
also suppresses the damaging iron-catalyzed redox reactions.[15] Overall, whole grains are a potent source of
numerous antioxidant compounds that may help to inhibit oxidative damage.[16] Whole grains are also important dietary
sources of water-soluble, fat-soluble, and insoluble antioxidants. The long
list of cereal antioxidants includes vitamin E, tocotrieonols, selenium,
phenolic acids, and phytic acid” AJCN 1999. But merely listing potential
beneficial chemicals in wheat germ and bran doesn’t prove that they are of
value in whole grain commercial breads, or that they are bioavailable. Per 100
gm of whole wheat flour, the germ
portion is 3 gm. The table in Wiki
shows that of FDA minimum daily requirements a portion of 100 gm of whole wheat
grain flour, the germ contributes 28% of magnesium and 5% of zinc. Phytic acid
in the gut bonds to mineral
to form insoluble salts, and thus is not absorbed from the gut. Unfortunately, the content in nut and legumes varies
greatly based
on soil and plant genetics, which makes quantification over a wide range.
For general guidance assume that the
absorption rate has been lowered by 50% when the meal includes a sizeable
portion of nut products. Nut products include nut oil such as soy bean,
legumes, nuts, and whole grains. As
for
mineral absorption from nuts legumes, and whole grains assume that they is less
than 25%. Given this negative effect of phytic
acid in wholegrains, white bread is preferred. (For more on phytic acid go to the Weston
Price Foundation site.) The literature
critical of processed foods praises whole wheat for its lower glycemic index
(slower rate of absorption over measured during the 2 hours from
ingestion). Because sugar is added
to
mask the bitter taste, and the use of softeners, the popular whole wheat bread
has nearly the same ratings as white bread.
“However, most breads made with 100% whole
wheat or wholemeal flour have a GI not very different than endosperm only (white)
bread. Many brown breads are treated
with enzymes to soften the crust,
which makes the starch more accessible (high GI)” Wiki. Given
the loss of calcium in whole-wheat bread from phytic acid, Consumer Report be added, for both are essential and frequent
Americans are deficient of. As for
nuts
and legumes and nut oils, their benefits as sources of proteins and slower
absorption (resistant starches, next section) of carbs entails that they make
up for the lower bioavailability of minerals.
Nut oils are preferred for a much different reason, they are high in
monounsaturated fats, and thus are far more healthful that the polyunsaturated
fats that are subject to rancidification in the body and are high in the
omega-6 fatty acids.
|
Food
|
Food Type
|
Glycemic Index score
|
Insulin score
| |
White bread(baseline)
|
Carbohydrate-rich
|
71 ± 0
|
100 ± 0
| |
Whole-meal bread[n
2]
|
Carbohydrate-rich
|
97 ± 17
|
96 ± 12
| |
White Pasta
|
Carbohydrate-rich
|
46 ± 10
|
40 ± 5
| |
White rice
|
Carbohydrate-rich
|
110 ± 15
|
79 ± 12
| |
Grain bread[n
1]
|
Carbohydrate-rich
|
60 ± 12
|
56 ± 6
|
Rye bread containing 47% kibbled rye, Holt et al. Breads with grain berries also rate
similar. Bread made from whole-meal wheat flour—Source Wikipedia Insulin Index.
Dietary Fiber is the indigestible portion of polysaccharides derived
from plants. It is divided into
2 classes:
Soluble fiber which dissolves in water and is fermented by bacterial
in the colon into gases and physiologically active byproducts and can be prebiotic[17] and insoluble fiber which is metabolically
inert and provides bulking and thereby promote intestinal peristalsis.
Some insoluble fibers are metabolically
fermented by bacteria in the large intestine and are prebiotic.
“Generally, however,
it is assumed that a prebiotic should increase the number and/or activity of bifidobacteria and lactic acid bacteria. The importance of the bifidobacteria and the
lactic acid bacteria (LABs) is that these groups of bacteria may have several
beneficial effects on the host, especially in terms of improving digestion
(including enhancing mineral absorption[10]) and the
effectiveness and intrinsic strength of the immune system” Wiki. Major sources
typical amounts cooked grams per
cup: beans 15, whole grains 4, hulled grains 2.5, fruits 4, vegetables 6. All is not positive, for along with
phytic acid “dietary fiber may bind metallic cations in both in vitro and in
vivo studies” 1991. Two large epidemiological studies have failed to find a
reduction in colon tumors or cancer with a high fiber diet. Given its minor role in promoting health, it
is near the bottom of my list of dietary concerns. .
Fiber promotes satiation thus lowers calories per meal and it
contributes on an average just 2 calories per gram. Other groups of compounds not digestible
include waxes and lignans which are polyphenolic substances derived from the
amino acid phenylalanine via dimerization or cinamic acid.
“Both obesity
and Type 2 Diabetes are diseases caused by excessive insulin. Insulin
resistance develops over time, with persistently high insulin. If fibre can
protect against elevated insulin, then it should protect against Type 2
Diabetes” 2015 Dr. Fung. Dietary recommended
amount is 25 grams per day. Rather
focus
on healthful meals as to quantity of fiber, focus on the amount of sugar and
keeping insulin response low. Low
insulin response is promoted by small meals and frequent healthful snacks (low
in carbs). Other factors include
exercise prior to and subsequent a meal, fiber, fats, and to a lesser extent
protein, and of course eating foods with a low insulin index.
A healthful diet has many ingredients.
Starch, resistant starch (RS) and
metabolic syndrome “Glucose is absorbed at a higher rate from white
flour products
than whole wheat products, thus white rice, potatoes, and white bread have a higher glycemic index (blood-sugar
level will become high and remain their
longer). Thus whole wheat is beneficial for those with metabolic syndrome and type
2 diabetes—but not whole wheat bread because of processing which makes its
glycemic index just 3% lower than white bread.
Since there are many different chemical structures of starch and the
digestive enzymes vary as to their ability to hydrolyze them their glycemic
index, glycemic load, and insulin index scores varies. There is strong evidence that cooked starch
affects insulin more than resistant starch[18]
(RS).
Fibers, mostly cellulose are partially digested
hours later by intestinal flora and absorbed in the small and large intestines
and thus contribute to the 2 hour window in which the 3 above named indexes are
measured.
Resistant starch has
been categorized into four types:
RS3 Resistant starch that is
formed when starch-containing foods are cooked and cooled such as in legumes, breads,
cornflakes, and cooked-and-chilled potatoes, pasta salad or sushi rice. Occurs due to retrogradation, which refers to the
collective processes of dissolved starch becoming less soluble after being
heated and dissolved in water and then cooled.
RS4 Starches that have been
chemically modified to resist digestion. This
type of resistant starches can have a wide variety of structures and are not
found in nature. “Research
of RS2 resistant starches from
high amylose corn indicates benefits in intestinal/colonic health
as well
as metabolic benefits in glycemic management, satiety and hunger, and eye health. Different types of source of resistant starch
are digested and/or fermented differently and thus must be considered
individually” Resistant starch reduces glycemic response … R2 increases insulin
sensitivity” Wiki. In Journal 2004: “RS intake is associated with
several
changes in metabolism which may confer some health benefits. RS intake seems to
decrease postprandial glycemic and insulinemic responses, lower plasma
cholesterol and triglyceride concentrations, improve whole body insulin
sensitivity, increase satiety, and reduce fat storage.” Positive effects have also been found for RS
in the large bowel. In journal 2005: “Several indices of large-bowel function, including short-chain
fatty acids, were improved relative to standard whole meal wheat. These results
indicate that this high-amylose wheat has a significant potential to improve
human health.” The next section on
glycemic index (GI) & table is
instructive as to RS in that it
measures the extracted carbohydrates minus fiber from different foods and gives
a comparative rating as to the total blood-glucose level over a 2-hour period
with pure glucose powder rated as 100.
|
Examples of
naturally-occurring resistant starch[8]
| |
Food
|
Serving Size
|
Resistant Starch
(grams)
| |
Banana,
raw, slightly green
|
1
medium, peeled
|
4.7
| |
High
amylose RS2 corn resistant starch
|
1
tablespoon (9.5 g)
|
4.5
| |
Green
Peas, frozen
|
1
cup, cooked
|
4.0
| |
White beans
|
1/2
cup, cooked
|
3.7
| |
Lentils
|
1/2
cup cooked
|
2.5
| |
Cold
pasta
|
1
cup
|
1.9
| |
Pearl barley
|
1/2
cup cooked
|
1.6
| |
Cold
potato
|
1/2"
diameter
|
0.6 - 0.8
| |
Oatmeal
|
1
cup cooked
|
0.5
|
[1]
Orientals eating a traditional diet high in white, polished rice and just 15
grams of sugar. They have a very low
incidence of CVD.
[2]
Metabolic syndrome is a disorder of
energy utilization and storage, diagnosed by a co-occurrence of three out of
five of the following medical conditions: abdominal (central) obesity, elevated
blood pressure, elevated fasting plasma glucose, high serum triglycerides, and
low high-density cholesterol (HDL) levels.
As shown in Part 2, triglycerides, LDL and HDL are not causal for CVD and
should not be included in metabolic syndrome (though pharma treats hyperlipidemia)
and should be removed from the list.
This
leaves the list at 3, and hereafter I
will consider it just obesity, elevated fasting glucose, and insulin
resistance.
[3] Most of the fructose is converted to
triglycerides in the liver, thereby causes fatty liver disease.
[4] “Compared with
consumption of high glucose beverages, drinking high-fructose beverages with
meals results in lower circulating insulin and leptin levels, and higher ghrelin levels after the meal.[69] Since leptin and insulin decrease appetite and
ghrelin increases appetite, some researchers suspect that eating large amounts
of fructose increases the likelihood of weight gain, Wiki.
[5]
“Although other cells can use other fuels
(most prominently fatty acids), neurons depend on glucose as a source of energy in the
non-starving human. They do not require insulin to absorb glucose, unlike
muscle and adipose tissue, and they have very small internal stores of
glycogen. Glycogen stored in liver cells (unlike glycogen stored in muscle
cells) can be converted to glucose, and released into the blood, when glucose
from digestion is low or absent, and the glycerol backbone in triglycerides can also be used to
produce blood glucose” Wiki.
[6]
Glycation is a process
where a monosaccharide attaches randomly to a protein and often damages it, in
this case to LDL.
[7]
High levels of triglycerides are good because they are a safer source of energy
that carbs which cause glycation and thus CVD.
[8] “Given that estradiol has been
documented to
exert an antioxidant effect, we investigated whether female rats were better
protected than males against the adverse effects of a high-sucrose diet, and we
studied the influence of hormonal status in female rats” at.
[9]
American Association for
the study of Liver Disease,
2013:“Nonalcoholic fatty liver disease (NAFLD) is
the most common chronic liver disease in adults and children. A number of
genetic and environmental factors are known to predispose individuals to NAFLD.
Certain dietary sugars, particularly fructose, are suspected to contribute to
the development of NAFLD and its progression. The increasing quantity of
fructose in the diet comes from sugar additives (most commonly sucrose and high
fructose corn syrup) in beverages and processed foods. Substantial links have
been demonstrated between increased fructose consumption and obesity, dyslipidemia, and insulin resistance.
Growing evidence suggests that fructose contributes to the development and
severity of NAFLD. In human studies, fructose is associated with increasing
hepatic fat, inflammation, and possibly fibrosis. Whether fructose alone can
cause NAFLD or if it serves only as a contributor when consumed excessively in
the setting of insulin resistance, positive energy balance, and sedentary
lifestyle is unknown. Sufficient evidence exists to support clinical
recommendations that fructose intake be limited through decreasing foods and
drinks high in added (fructose-containing) sugars.” Pharma has drugs for NAFLD.
[10]
“In
addition to AGEs, RAGE binds certain members of the S100/calgranulin family,
high-mobility group box 1 (HMGB1), and β-amyloid peptide and
β-sheet
fibrils. Recent studies demonstrate beneficial effects of RAGE antagonism and
genetic deletion in rodent models of atherosclerosis and ischaemia–reperfusion
injury in the heart and great vessels” Supra.
[11] Galactose is mainly found in
dairy products where it is bonded to glucose to form lactose (milk sugar); thus
not a major sugar. Moreover unlike
fructose it is not converted to fat which damages the liver. It is converted by the Leloir pathway to glucose. And it gets worse, because fructose
level
remains twice as high as glucose thus doubling its amount of glycation.
[12] “Glycemic Index
(GI): A
measure of the blood-glucose level
over 2 hour after 12 h ours of fasting to a certain quantity of food, usually
50 grams based on the measurement of 10 subjects.
High GI is associated with an increase in glycation, the process of
forming a covalent bond of a protein or lipid molecule with a sugar molecule,
of which some of these molecules release
highly oxidizing side-products such as hydrogen peroxide” Wiki and Wiki.
GI is weakly
associated to glycation for 2 reasons, one it that it only measures glucose
(not fructose), and second, fructose causes glycation at 7-10 times the rate of
glucose. Moreover, “fructose
has a very low glycemic index of 19 ± 2, compared with 100 for glucose and 68 ±
5 for sucrose” Wiki
. Thus
the health consequences are far greater than indicated by GI. In addition, the equally significant
peroxides generated by catabolism of sugars are not measured. For these reasons a new index measuring sugar
generated damage is need.
[13]
They eat traditionally a high carbohydrate consisting of poi from the taro
plant, But until the introduction of
sugar and grains with the Western diet they were of normal weight—see 19th
century Wikipedia
pictures and
1816.
[14] Phytic acid is commonly known as inositol,
inositol hexakisphosphate, (IP6),
inositol polyphosphate and phytate. In
plant seeds it is the principle source of energy, phosphate, and myoinositol (a
cell wall precursor) for seedlings
[15] This
statement and the subsequent are indications that the author is selling his
belief, rather than being balanced. Iron
is an essential nutrient used in hemoglobin for the absorption of oxygen from
the air. Thus though phytic acid by
lowering blood iron reduces the redox reaction, the net effect of lower iron is
negative. Lower calcium absorption was
why a Consumer Report panel recommended white bread over whole wheat bread in
the 1970s.
[16]
To inhibit oxidative damage causing AS
and CVD this
must occur in the lumen
of the arteries in a way that protect LDL.
It is doubtful that these nutrients would be in sufficient quantity to
have a major impact upon the process.
[17] Prebiotics is a general term to
refer to chemicals that induce the growth and/or activity of commensal microorganisms (e.g.,
bacteria and fungi) that contribute to the
well-being of their host.
[18]
“The differing rates of absorption between
RS and digestible starch are thought
to denote their differential metabolic responses. RS intake is associated with several changes in metabolism which
may confer some health benefits. RS intake seems to decrease postprandial
glycemic and insulinemic responses, lower plasma cholesterol and triglyceride
concentrations, improve whole body insulin sensitivity, increase satiety, and
reduce fat storage. These properties make RS
an attractive dietary target for the prevention of diseases associated with
dyslipidemia and insulin resistance as well as the development of weight loss
diets and dietary therapies for the treatment of Type 2 diabetes and coronary
heart disease. This review analyzes the body of literature examining the
metabolic effects of RS consumption and discusses possible mechanisms whereby
increased short-chain fatty acid production in the bowel could account for some
of these effects” 2004, AOAC.. .
|
|
|
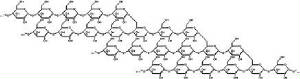
| Starch molecule--tiny part of glucose chain |
|
Corn syrup (glucose syrup) “is a food syrup, which
is made from the starch of corn and contains varying amounts
of maltose and higher oligosaccharides,
depending on the grade. Corn syrup
is distinct from high-fructose
corn syrup (HFCS),
which is manufactured from corn syrup by converting a large proportion of its glucose into
fructose using the enzyme xylose
isomerase, thus producing
a sweeter compound due to higher levels of
fructose. A bushel (25 kg) of corn
will yield an average of 31.5 pounds (14.3 kg) of starch, which in turn
will yield about 33.3 pounds (15.1 kg) of syrup. Glucose syrup was the primary corn sweetener
in the United States prior to the expanded use of high fructose
corn syrup production. HFCS is
a
variant in which other enzymes are used to convert some of the glucose into fructose.
Corn syrup is also available as
a retail product. The best-known brand in the U.S. is Karo” Wiki.
Maltose, malt
sugar, “is a disaccharide formed from two units
of glucose joined with an α(1→4) bond.
Maltose
is the disaccharide produced when amylase breaks down starch. It
is found in germinating seeds such as barley as they break down
their
starch stores to use for food. It is also produced when glucose is caramelized.
In humans, maltose is
broken down by the enzyme maltase so that there are two glucose molecules from
which the glucose metabolism obtains energy”
Wiki. Since Maltose and
Karo are without fructose, they
are the preferred sweeteners.
In summary:
Fructose because of its failure to stimulate
insulin-leptin brain control of appetite is the primary cause of obesity in
those on a high sugar diet. Fructose
because of its 10 fold greater rate of glycation causes more damage than
glucose. The increase in sugar in
the
diet has caused a rapid rise in the rate of diabetes, metabolic syndrome, fatty
liver, and insulin resistance. Strenuous
exercise diminishes the effect of sugar overload by burning off the in the
muscles the excess glucose. Thus
it
would seem that a low sugar diet high starch diet would provide a safer source
of ATP (energy). But one of the
indicators of metabolic syndrome is high blood glucose. Should glucose play a greater role and are
all starches equal?
Whole grain wheat compared to white flour. There is a chorus of critics of the western diet; they extol the Paleolithic diet which is without
processed grains, trans-fats, and the liberal use of sucrose.
Are they right, and if so how right about
whole-grain flour? Since wheat is
the
main source of starch (refined wheat) in the Western diet, is whole grain wheat
superior? The affirmative answer
has
become a truism, but white flour remains far more popular because it tastes
better. While epidemiological studies answer in the
affirmative, there are so many contravening variables that a biological answer
would be dispositive. Whole grain
wheat
has 14% bran and 3% germ, thus only 83% endosperm, while
white flour is all endosperm; refined (white) flour is just endosperm.
A number of nutrients are found in the germ:
“Whole-grain foods are rich sources of
antioxidants, including vitamins, trace minerals, phenolic acids, lignans, and
phytoestrogens. Vitamin E and selenium are particularly concentrated in whole
grains. Other trace minerals such as copper, zinc, and manganese are also found
in the outer layer of grains. In addition, phytic acid, traditionally
considered an anti-nutrient, may also function as an antioxidant. In
particular, phytic acid has the ability to form chelates with a variety of
metals [prevents their absorption from foods], suppressing damaging iron-catalyzed
redox reactions.[1] Overall, whole grains are a potent source of
numerous antioxidant compounds that may help to inhibit oxidative damage.[2] Whole grains are also important dietary
sources of water-soluble, fat-soluble, and insoluble antioxidants. The long
list of cereal antioxidants includes vitamin E, tocotrieonols, selenium,
phenolic acids, and phytic acid” AJCN 1999. But merely listing potential
beneficial chemicals in wheat germ and bran doesn’t prove that they are. Per
100gm of whole wheat flour, the germ
portion is 3 gm. The table in Wiki
shows that of FDA minimum daily requirements a portion of 100 gm of whole wheat
grain flour, the germ contributes 28% of magnesium and 5% of zinc. The other
afore mentioned nutrients are in insignificant amounts. Phytic acid in the gut
binds mineral to form
insoluble salts, and in the body these other chemical listed above might do
more harm than good. Unfortunately, a search
of the literate has not provided the quality laboratory answers as to the
benefit for the above listed nutrient in the small amount found in whole wheat;
therefore it is assumed that is not a significant reason for whole wheat.
The literature critical of processed foods
also praises whole wheat for its lower glycemic index (slower rate of
absorption over measured during the 2 hours from ingestion).
What is the evidence?
Starch, resistant starch (RS) and metabolic syndrome “Glucose is absorbed at a higher rate from white flour products
than whole wheat products, thus white rice, potatoes, and white bread have a
higher glycemic index (blood-sugar level will become high and remain their
longer). Thus whole wheat is beneficial for those with metabolic syndrome and type
2 diabetes. But what of those without
these issues? A diet high
in sucrose and fructose greatly
increases the risk of developing insulin resistance, metabolic syndrome, and
fatty liver. And though starch is
chains
of glucose, the whole grains are absorbed slower, which lowers the glycemic
index, glycemic load, and insulin index scores.
There is strong evidence that cooked starch affects insulin more than
resistant starch[3] (RS, any starch that
is not digested in the small intestines).
Resistant starch has been categorized
into four types:
RS3 Resistant starch that is
formed when starch-containing foods are cooked and cooled such as in legumes,[2] bread,
cornflakes and cooked-and-chilled potatoes, pasta salad or sushi rice. Occurs due to retrogradation,
which refers to the collective processes of dissolved starch becoming less
soluble after being heated and dissolved in water and then cooled.
RS4 Starches that have been
chemically modified to resist digestion. This
type of resistant starches can have a wide variety of structures and are not
found in nature. “Research of RS2 resistant
starches from
high amylose corn indicates benefits in intestinal/colonic health
as well
as metabolic benefits in glycemic management, satiety and hunger, and eye health. Different types of source of resistant starch
are digested and/or fermented differently and thus must be considered
individually” Resistant starch reduces glycemic response … R2 increases insulin
sensitivity” Wiki. In Journal 2004: “RS intake is associated
with several
changes in metabolism which may confer some health benefits. RS intake seems to
decrease postprandial glycemic and insulinemic responses, lower plasma
cholesterol and triglyceride concentrations, improve whole body insulin
sensitivity, increase satiety, and reduce fat storage.” Positive effects have also been found for RS
in the large bowel. In journal 2005: “Several indices of large-bowel function, including
short-chain
fatty acids, were improved relative to standard whole meal wheat. These results
indicate that this high-amylose wheat has a significant potential to improve
human health.” The next section on
glycemic index (GI) & table is
instructive as to RS in that it
measures the extracted carbohydrates minus fiber from different foods and gives
a comparative rating as to the total blood-glucose level over a 2-hour period
with glucose rated as 100.
|
Examples of
naturally-occurring resistant starch[8]
|
|
Food
|
Serving Size
|
Resistant Starch
(grams)
|
|
Banana,
raw, slightly green
|
1
medium, peeled
|
4.7
|
|
High
amylose RS2 corn resistant starch
|
1
tablespoon (9.5 g)
|
4.5
|
|
Green
Peas, frozen
|
1
cup, cooked
|
4.0
|
|
White
beans
|
1/2
cup, cooked
|
3.7
|
|
Lentils
|
1/2
cup cooked
|
2.5
|
|
Cold
pasta
|
1
cup
|
1.9
|
|
Pearl barley
|
1/2
cup cooked
|
1.6
|
|
Cold
potato
|
1/2"
diameter
|
0.6 - 0.8
|
|
Oatmeal
|
1
cup cooked
|
0.5
|
The rate
of digestion and absorption of carbohydrates has important
health consequences. Glycemic index
(GI), glycemic load (GL),and insulin
load are standardized imperfect
methods for measuring the effect of foods short-term; and there are published
tables. GI is a measure of
pure carbohydrate from a food on the blood glucose level for 2 hours against
standard of pure glucose. GL measures
the effect of a food on the
blood glucose level, thus taking the GI number and multiplying the number of
grams in a 100 gram portion. Insulin
load is the insulin response to
various foods. What
is their values for healthful diet?
Glycemic
index (GI): “A measure of the blood-glucose
level over 2 hour after 12 h ours of fasting to a certain quantity of food,
usually 50 grams based on the measurement of 10 subjects. Glucose (the
defining standard) has a glycemic index of 100. The glycemic index estimates how much each
gram of available carbohydrate
(total carbohydrate minus fiber) in a food raises a person's blood glucose
level following consumption of the food, relative to consumption of pure
glucose. GI is
a way of measuring different digestible carbohydrates [minus fiber] blood
production of glucose in the first 2 hours; it doesn’t measure the resultant
production of insulin. Glycemic
index and glycemic load measurements
are defined by the carbohydrate content of food. For something
like steak, which has no
carbohydrate content but can nonetheless trigger an insulin response due to
high protein intake, GI and
GL provide little information. Glycemic index charts often give only
one value per food, but variations are possible due to variety, ripeness,
cooking methods, processing, and the length of storage. Potatoes are a notable example, ranging from moderate to
very high GI even within the same variety.
The glycemic response is different from one person to
another, and also in the same person from day to day, depending on blood
glucose levels, insulin resistance,
and other factors. Most of the values on the glycemic index do not show the
impact on glucose levels after two hours. Some people with diabetes may have
elevated levels after four hours. Foods generally considered to be unhealthy can have a
low glycemic index, for instance, chocolate
cake (GI 38), ice cream
(37), or pure fructose (19), whereas foods like potatoes and rice have
GIs around 100 but are commonly eaten in some countries with low rates of
diabetes. In
one study,[16] male
rats were split into high- and low-GI groups
over 18 weeks while mean body weight was maintained. Rats fed the high-GI diet were
71% fatter and had 8% less lean body mass than the low-GI group. Post-meal glycemia and insulin levels were significantly higher, and plasma triglycerides were threefold greater in the high-GI-fed rats.
Furthermore, pancreatic islet cells suffered "severely disorganized
architecture and extensive fibrosis." However, the GI of these diets was not
experimentally determined” Wiki. High
GI is associated with an increase in glycation, the process of forming a covalent
bond of a protein or lipid molecule with a sugar molecule, of which
some of these molecules release
highly oxidizing side-products such as hydrogen peroxide” Wiki
and Wiki.
GI is weakly associated to glycation for 2 reasons, one it that it only
measures glucose (not fructose), and second, fructose causes glycation at 7-10
times the rate of glucose. Moreover, “fructose has a very low glycemic index of
19 ± 2, compared with 100 for glucose and 68 ±
5 for sucrose” Wiki
. Thus the health consequences are far
greater than indicated by GI. In
addition, the equally significant peroxides generated by catabolism of sugars
are not measured. For these reasons
a
new index measuring sugar generated damage is need.

“The glycemic effect
of foods depends on
a number of factors, such as the type of starch (amylose versus amylopectin), physical entrapment of the starch molecules
within the food, fat and protein content of the food and organic acids or their
salts in the meal — adding vinegar, for example, will lower the GI. The presence
of fat or soluble dietary fiber can slow the gastric emptying rate, thus
lowering the GI. In general, coarse, grainy breads with higher amounts of fiber
have a lower GI value than white breads.[8] However,
most breads made with 100% whole wheat or wholemeal flour have a GI not very
different than endosperm only (white) bread. Many brown breads are
treated with enzymes to soften the crust, which makes the starch
more accessible (high GI)” Wiki.
NOTE: For
the
tables below, the carbohydrate fructose only slightly affects the GI, GL and
Insulin index -- diet
choices should take into account the sugar and fructose content. GI is a measure
for pure carbohydrate minus
fiber in a food as to the glucose-blood level in 2 hour period. GL adjust for
the amount of carbohydrates in
a portion, thus watermelon has a high GI, 72, but since it is mostly water a
low GL, 4.
[1] This
statement and the subsequent are indications that the author is selling his
belief, rather than being balanced. Iron
is an essential nutrient used in hemoglobin for the absorption of oxygen from
the air. Thus though phytic acid
by
lowering blood iron reduces the redox reaction, the net effect of lower iron is
negative. Lower calcium absorption
was
why a Consumer Report panel recommended white bread over whole wheat bread in
the 1970s.
[2]
To inhibit oxidative damage causing AS
and CVD this must occur in the lumen
of the arteries in a way that protect LDL.
It is doubtful that these nutrients would be in sufficient quantity to
have a major impact upon the process.
[3]
“The differing rates of absorption between
RS and digestible starch are thought
to denote their differential metabolic responses. RS intake is associated with
several changes in metabolism which may confer some health benefits. RS intake
seems to decrease postprandial glycemic and insulinemic responses, lower plasma
cholesterol and triglyceride concentrations, improve whole body insulin
sensitivity, increase satiety, and reduce fat storage. These properties make RS
an attractive dietary target for the prevention of diseases associated with
dyslipidemia and insulin resistance as well as the development of weight loss
diets and dietary therapies for the treatment of Type 2 diabetes and coronary
heart disease. This review analyzes the body of literature examining the
metabolic effects of RS consumption and discusses possible mechanisms whereby
increased short-chain fatty acid production in the bowel could account for some
of these effects” 2004, AOAC.. .
The rate of
digestion and absorption of carbohydrates has important health
consequences. Glycemic index (GI),
glycemic
load (GL), and insulin load are
standardized, imperfect methods for measuring the effect of foods short-term
upon carbohydrate load from foods and the insulin response--tables (below). GI
is a measure of pure
carbohydrate from a food on the blood glucose level for 2 hours against
standard of pure glucose. GL measures
the effect of a food on the
blood glucose level, thus taking the GI number and multiplying the number of
grams in a 100 gram portion. Insulin
load is the insulin response to
various foods. GI is the most commonly
used values in diet literature, and IL the
least, though as to health consequences IL is the most important because
elevated insulin is most closely associate with MeS and T2D.
Glycemic index
(GI): It
measures how high the serum glucose go over 2 hours with 50 grams of carbs from
that food source as compared to 50 grams of pure glucose. “A
measure of the blood-glucose level over 2 hour after 12 h ours of fasting to a
certain quantity of food, usually 50 grams based on the measurement of 10
subjects. Glucose (the defining standard) has a glycemic index of 100. The
glycemic index estimates how much each
gram of available carbohydrate (total carbohydrate minus fiber) in a food raises a
person's blood glucose level following consumption of the food, relative to
consumption of pure glucose. GI is
a way of measuring different digestible carbohydrates [minus fiber] blood
production of glucose in the first 2 hours; it doesn’t measure the resultant
production of insulin. Glycemic
index and glycemic load measurements
are defined by the carbohydrate content of food. For something like steak, which has no
carbohydrate content but can nonetheless trigger an insulin response due to
high protein intake, GI and GL provide little information. Glycemic index charts often give only one
value per food, but variations are possible due to variety, ripeness, cooking
methods, processing, and the length of storage. Potatoes are a notable example, ranging from moderate to
very high GI even within the same variety.
The glycemic response is different from one person to
another, and also in the same person from day to day, depending on blood
glucose levels, insulin
resistance, and
other factors. Most of the values on the glycemic index do
not show the impact on glucose levels after two hours. Some people with
diabetes may have elevated levels after four hours. Foods
generally considered to be unhealthy can have a low glycemic index, for
instance, chocolate cake (GI 38), ice cream (37), or pure fructose (19), whereas foods like potatoes and rice have
GIs around 100 but are commonly eaten in some countries with low rates of
diabetes. In one study, male rats were split
into high-
and low-GI groups over 18 weeks while
mean body weight was maintained. Rats fed the high-GI diet were
71% fatter and had 8% less lean body mass than the low-GI group [muscle metabolized
and replace with fat]. Post-meal glycemia and insulin levels were significantly higher, and plasma triglycerides were threefold greater in the high-GI-fed rats.
Furthermore, pancreatic islet
cells suffered "severely disorganized architecture
and extensive fibrosis." However, the GI of these diets was not experimentally determined”
Wiki. High
GI is associated with an increase in glycation, the process of forming a covalent
bond of a protein or lipid molecule with a sugar molecule, of which
some of these molecules release
highly oxidizing side-products such as hydrogen peroxide” Wiki
and Wiki.
GI is weakly associated to glycation for 2 reasons, one fructose has a very low glycemic index of 19 ± 2, compared
with 100 for glucose and 68 ±
5 for sucrose” Wiki;
and second, fructose causes glycation at 7-10 times the rate of glucose. Moreover, fructose
is cleared from the blood slower than glucose; its serum level for the first 2
hours is approximately twice that of glucose, thus doubling the 7 fold rate
compared to an equal bolus of glucose.
Thus the health
consequences are far greater than indicated by GI. For these reasons a new index measuring sugar-generated
damage is need.
“The glycemic effect
of foods depends on
a number of factors, such as the type of starch (amylose versus amylopectin), physical entrapment of the starch molecules within the food, fat and
protein content of the food and organic acids or their salts in the meal —
adding vinegar, for example, will lower the GI. The presence of fat or soluble dietary fiber can slow the gastric emptying rate, thus
lowering the GI. In general, coarse, grainy breads with higher amounts of fiber
have a lower GI value than white breads.[8] However, most breads
made with 100% whole wheat or wholemeal flour have a GI not very different than endosperm only (white) bread. Many
brown breads are treated with enzymes to soften the crust,
which makes the starch more accessible (high GI)” Wiki.
Starches are pure glucose, while sucrose is a disaccharide, and its
fructose component is not measured and has a low effect upon insulin.
NOTE: For
the tables below, the carbohydrate fructose only slightly affects the GI, GL
and Insulin index
--
diet choices should take into account the
sugar and fructose content. GI is a
measure for pure carbohydrate (minus fiber) in a food as to the glucose-blood
level in 2 hour period. GL adjust for
the amount of carbohydrates in a portion and includes fiber, water &
protein, thus watermelon has a high GI, 72, but a low GL, 4.
|
Classification
|
GI
range
|
Examples
|
|
Low GI
|
55 or less
|
beans (white, black, pink, kidney, lentil, soy, almond, peanut, walnut, chickpea);
small seeds (sunflower, flax, pumpkin, poppy, sesame); most
whole intact grains (durum/spelt/kamut wheat, millet, oat, rye, rice, barley); most vegetables, most
sweet fruits (peaches, strawberries, mangos); tagatose; fructose
|
|
Medium GI
|
56–69
|
Not intact whole
wheat* or enriched
wheat, pita
bread, basmati
rice, unpeeled boiled potato, grape
juice, raisins, prunes, pumpernickel bread, cranberry
juice,[7] regular ice
cream, sucrose, banana
|
|
High GI
|
70 and above
|
white
bread (only
wheat endosperm), most white
rice (only
rice endosperm), corn
flakes, extruded breakfast cereals, glucose, maltose, maltodextrins,
potato, pretzels, bagels
|
Whole wheat bread at http://en.wikipedia.org/wiki/Insulin_index GI 97,
II 96, white is 71, 100, thus essentially equal.
Glycemic load (GL): “of food is a number that estimates how much the
food will raise a person's blood glucose level after eating it. One unit of glycemic
load approximates the effect of
consuming one gram of glucose. Glycemic
load accounts for how much carbohydrate is in the food and how much each gram of
carbohydrate in the food raises blood glucose levels. Glycemic load is based on
the glycemic index (GI), and is defined as the fraction of
available carbohydrate in the food times the food's GI. GL is a GI-weighted measure of carbohydrate
content. For instance, watermelon has a high GI, but a typical serving of
watermelon does not contain much carbohydrate, so the glycemic load of eating
it is low. [But we eat more grams of watermelon than cookies.]
Whereas glycemic index is defined for each
type of food, glycemic load can be calculated for any size serving of a food,
an entire meal, or an entire day's meals.
Glycemic load of a serving of food can be calculated as its carbohydrate
content measured in grams (g), multiplied by the food's GI, and divided by 100.
For example, watermelon has a GI of 72. A 100-g serving of watermelon has 5 g
of available carbohydrates (it contains a lot of water), making the calculation
5 x 72/100=3.6, so the GL is 3.6. A food with a GI of 100 and 10 g of available
carbohydrates has a GL of 10 (10 x 100/100=10), while a food with 100 g of
carbohydrate and a GI of just 10 also has a GL of 10 (100 x 10/100=10).
The data on GI and GL listed in this article
is from the University of Sydney (Human Nutrition Unit) GI database.
http://www.health.harvard.edu/glycemic
Glycemic index and glycemic load for 100+ foods
|
FOOD
|
Glycemic index (glucose = 100)
|
Serving size (grams)
|
Glycemic load per serving
|
|
BAKERY PRODUCTS AND BREADS
|
|
|
|
|
Banana cake,
made with sugar
|
47
|
60
|
14
|
|
Bagel,
white, frozen
|
72
|
70
|
25
|
|
Baguette,
white, plain
|
95
|
30
|
15
|
|
Waffles, Aunt Jemima
(Quaker Oats)
|
76
|
35
|
10
|
|
Hamburger
bun
|
61
|
30
|
9
|
|
Kaiser
roll
|
73
|
30
|
12
|
|
Pumpernickel
bread
|
56
|
30
|
7
|
|
50%
cracked wheat kernel bread
|
58
|
30
|
12
|
|
White
wheat flour bread
|
71
|
30
|
10
|
|
Corn
tortilla
|
52
|
50
|
12
|
|
Wheat
tortilla
|
30
|
50
|
8
|
|
BEVERAGES
|
Glycemic
index
|
Serving
size
|
Glycemic
load
|
|
Coca
Cola®, average
|
63
|
250 mL
|
16
|
|
Fanta®,
orange soft drink
|
68
|
250 mL
|
23
|
|
Apple
juice, unsweetened, average
|
44
|
250 mL
|
30
|
|
Cranberry
juice cocktail (Ocean Spray®)
|
68
|
250 mL
|
24
|
|
Gatorade
|
78
|
250 mL
|
12
|
|
Orange
juice, unsweetened
|
50
|
250 mL
|
12
|
|
Tomato
juice, canned
|
38
|
250 mL
|
4
|
|
BREAKFAST CEREALS AND RELATED
PRODUCTS
|
Glycemic
index
|
Serving
size
|
Glycemic
load
|
|
All-Bran™,
average
|
55
|
30
|
12
|
|
Coco
Pops™, average
|
77
|
30
|
20
|
|
Cornflakes™,
average
|
93
|
30
|
23
|
|
Cream
of Wheat™ (Nabisco)
|
66
|
250
|
17
|
|
Oatmeal,
average
|
55
|
250
|
13
|
|
Instant
oatmeal, average
|
83
|
250
|
30
|
|
Raisin
Bran™ (Kellogg's)
|
61
|
30
|
12
|
|
Special
K™ (Kellogg's)
|
69
|
30
|
14
|
|
GRAINS
|
|
|
|
|
Pearled
barley, average
|
28
|
150
|
12
|
|
Sweet
corn on the cob, average
|
60
|
150
|
20
|
|
White
rice, average
|
89
|
150
|
43
|
|
Quick
cooking white basmati rice
|
67
|
150
|
28
|
|
Brown
rice, average
|
50
|
150
|
16
|
|
Converted,
white rice (Uncle Ben's®)
|
38
|
150
|
14
|
|
Graham
crackers
|
74
|
25
|
14
|
|
Vanilla
wafers
|
77
|
25
|
14
|
|
Shortbread
|
64
|
25
|
10
|
|
Rice
cakes, average
|
82
|
25
|
17
|
|
Rye
crisps, average
|
64
|
25
|
11
|
|
Soda
crackers
|
74
|
25
|
12
|
|
DAIRY PRODUCTS AND ALTERNATIVES
|
Glycemic
index
|
Serving
size
|
Glycemic
load
|
|
Ice
cream, regular
|
57
|
50
|
6
|
|
Ice
cream, premium
|
38
|
50
|
3
|
|
Milk,
full fat
|
41
|
250mL
|
5
|
|
Milk,
skim
|
32
|
250 mL
|
4
|
|
Reduced-fat
yogurt with fruit, average
|
33
|
200
|
11
|
|
FRUITS
|
Glycemic
index
|
Serving
size
|
Glycemic
load
|
|
Apple,
average
|
39
|
120
|
6
|
|
Banana,
ripe (green much lower)
|
62
|
120
|
16
|
|
Dates,
dried (large portion)
|
42
|
60
|
18
|
|
Grapefruit
|
25
|
120
|
3
|
|
Grapes,
average
|
59
|
120
|
11
|
|
Orange,
average
|
40
|
120
|
4
|
|
Peach,
average
|
42
|
120
|
5
|
|
Peach,
canned in light syrup
|
40
|
120
|
5
|
|
Pear,
average
|
38
|
120
|
4
|
|
Pear,
canned in pear juice
|
43
|
120
|
5
|
|
Prunes,
pitted
|
29
|
60
|
10
|
|
Raisins
|
64
|
60
|
28
|
|
Watermelon
|
72
|
120
|
4
|
|
BEANS AND NUTS
|
Glycemic
index
|
Serving
size
|
Glycemic
load
|
|
Baked
beans, average (canned higher)
|
40
|
150
|
6
|
|
Black
beans
|
30
|
150
|
7
|
|
Soy
beans, average
|
15
|
150
|
1
|
|
Cashews,
salted
|
27
|
50
|
3
|
|
Peanuts,
average
|
7
|
50
|
0
|
|
PASTA and NOODLES
|
Glycemic
index
|
Serving
size
|
Glycemic
load
|
|
Fettucini,
average
|
32
|
180
|
15
|
|
Macaroni,
average
|
47
|
180
|
23
|
|
Macaroni
and Cheese (Kraft)
|
64
|
180
|
32
|
|
Spaghetti,
white, boiled, average
|
46
|
180
|
22
|
|
SNACK FOODS
|
Glycemic
index
|
Serving
size
|
Glycemic
load
|
|
Corn
chips, plain, salted, average
|
42
|
50
|
11
|
|
Fruit
Roll-Ups®
|
99
|
30
|
24
|
|
M
& M's®, peanut
|
33
|
30
|
6
|
|
Microwave
popcorn, plain, average
|
55
|
20
|
6
|
|
Potato
chips, average
|
51
|
50
|
12
|
|
Pretzels,
oven-baked
|
83
|
30
|
16
|
|
Snickers
Bar®
|
51
|
60
|
18
|
|
VEGETABLES
|
Glycemic
index
|
Serving
size
|
Glycemic
load
|
|
Green
peas, average
|
51
|
80
|
4
|
|
Carrots,
average
|
35
|
80
|
2
|
|
Baked
russet potato, average
|
111
|
150
|
33
|
|
Boiled
white potato, average
|
82
|
150
|
21
|
|
Instant
mashed potato, average
|
87
|
150
|
17
|
|
Sweet
potato, average
|
70
|
150
|
22
|
|
Yam,
average
|
54
|
150
|
20
|
|
MISCELLANEOUS
|
Glycemic
index
|
Serving
size
|
Glycemic
load
|
|
Hummus
(chickpea salad dip)
|
6
|
30
|
0
|
|
Chicken
nuggets, frozen, reheated in microwave oven 5 min
|
46
|
100
|
7
|
|
Pizza,
plain baked dough, served with parmesan cheese and tomato sauce
|
80
|
100
|
22
|
|
Pizza,
Super Supreme (Pizza Hut)
|
36
|
100
|
9
|
|
Honey
average
|
61
|
25
|
12
|
|
FOOD
|
Glycemic
index (glucose = 100)
|
Serving
size (grams)
|
Glycemic
load per serving
|
“While
a
higher satiety score indicates how much less was eaten from a buffet after
participants ate the listed food” Wiki
Insulin Index
is a measure used to
quantify the typical insulin response to various foods. The index is similar
to the Glycemic Index and Glycemic Load, but rather than relying on blood glucose levels, the Insulin Index is based upon blood
insulin levels. This measure can be more
useful than either the Glycemic Index or the Glycemic Load because certain
foods (e.g., lean meats and proteins) cause an insulin response despite there
being no carbohydrates present, and some foods cause a
disproportionate insulin response relative to their carbohydrate load. Holt et
al. have noted that the glucose and insulin scores of most foods are highly
correlated, but high-protein foods and bakery products that
are rich in fat and refined carbohydrates "elicit insulin responses that
were disproportionately higher than their glycemic responses." They also
conclude that insulin indices may be useful for dietary management and
avoidance of non-insulin-dependent [type-2] diabetes mellitus and
hyperlipidemia. The Insulin Index is not based on regular portions (as are some
other glycemic indices, see external links), but on eating 1000 kilo joules
(239 kilo calories) of that food. So
while apples have a higher insulin/glucose index than white pasta, it shouldn't
then be considered that they're less healthy; because in a single sitting most
people ate a portion of apple smaller than that (~100 Calories per regular size
apple) and a normal portion for spaghetti is closer to 500 Calories.
Glucose (glycemic) and insulin scores were
determined by feeding 1000 kilojoules (239 kilocalories) of the food to the
participants and recording the area under the glucose/insulin curve for 120
minutes then dividing by the area under the glucose/insulin curve for white
bread. The result being that all scores are relative to white bread” rated
at 100 Wiki. For
a table of Insulin Index http://www.nutrientdataconf.org/pastconf/ndbc35/4-2_sampson.pdf. Another useful source gives
nutrition values for 50 common foods using 1000 kjoul serving and includes glucose score and insulin
score, fat, protein, etc. at http://ajcn.nutrition.org/content/66/5/1264.full.pdf.
The figures below for insulin are found in table 4 of the article linked
above.
List of
foods and their glycemic load, per 100 g serving
All numeric values provided in the
table are approximate. Insulin index
is per 1,000 kilojoules of the
food
|
Food
|
Glycemic
index
|
Carbohydrate
content
(% by weight)
|
Glycemic
Load
|
Insulin
index
|
|
Baguette,
white, plain
|
95
(high)
|
50
|
48.0
|
—
|
|
Banana, Mean
of 10 studies
|
52
(low)–55.3±7 (low)
|
20
|
10–11.06±1.4
|
56.7±3.5
|
|
Carrots, mean
of 4 studies
|
47
(low)
|
7.5
|
3.5
|
—
|
|
Corn
tortilla
|
52
(low)
|
48
|
25.0
|
—
|
|
Potato, mean
of 5 studies
|
50
(low)–98.7±24.5 (high)
|
18.6
|
9.3–18.3582±4.557
|
84.7±7.7
|
|
Rice,
boiled white, mean of 12 studies
|
64±9
(medium)–77±10.5 (high)–83±13 (high)–93±11 (high)
|
77.5 –79.9–79.6
|
49.6±6.975 –60.83±8.295 –66.317±10.387 –74.028±8.756
|
40±10 –55.3±8.4 –67±15-67±11
|
|
Watermelon
|
72
(high)
|
5
|
3.6
|
—
|
Mean average glucose, insulin and satiety
scores (values) --
lower is better, but higher for satiety
|
Food
|
Food Type
|
Glycemic Index score
|
Insulin Index score
|
Satiety score
|
|
Honeysmaks
|
Breakfast Cereal
|
60
± 7
|
67
± 6
|
132
|
|
Special K
|
Breakfast Cereal
|
70 ± 9
|
66 ± 5
|
116
|
|
Average:
|
Breakfast Cereal
|
59 ± 3
|
57 ± 3
|
134
|
|
White bread(baseline)
|
Carbohydrate-rich
|
71 ± 0
|
100 ± 0
|
100
|
|
White Pasta
|
Carbohydrate-rich
|
46 ± 10
|
40 ± 5
|
119
|
|
French fries
|
Carbohydrate-rich
|
71 ± 16
|
74 ± 12
|
116
|
|
White rice
|
Carbohydrate-rich
|
110 ± 15
|
79 ± 12
|
138
|
|
Whole-meal bread
|
Carbohydrate-rich
|
97 ± 17
|
96 ± 12
|
157
|
|
Potatoes
|
Carbohydrate-rich
|
141 ± 35
|
121 ± 11
|
323
|
|
Average:
|
Carbohydrate-rich
|
88 ± 6
|
74 ± 8
|
158
|
|
Eggs
|
Protein-rich
|
42 ± 16
|
31 ± 6
|
150
|
|
Cheese
|
Protein-rich
|
55 ± 18
|
45 ± 13
|
146
|
|
Beef
|
Protein-rich
|
21 ± 8
|
51 ± 16
|
176
|
|
Lentils
|
Protein-rich
|
62 ± 22
|
58 ± 12
|
133
|
|
Fish
|
Protein-rich
|
28 ± 13
|
59 ± 18
|
225
|
|
Baked beans
|
Protein-rich
|
114 ± 18
|
120 ± 19
|
168
|
|
Average:
|
Protein-rich
|
54 ± 7
|
61 ± 7
|
166
|
|
Apples
|
Fruit
|
50 ± 6
|
59 ± 4
|
197
|
|
Oranges
|
Fruit
|
39 ± 7
|
60 ± 3
|
202
|
|
Bananas
|
Fruit
|
79 ± 10
|
81 ± 5
|
118
|
|
Grapes
|
Fruit
|
74 ± 9
|
82 ± 6
|
162
|
|
Average:
|
Fruit
|
61 ± 5
|
71 ± 3
|
169
|
|
Peanuts
|
Snack/confectionery
|
12 ± 4
|
20 ± 5
|
84
|
|
Popcorn
|
Snack/confectionery
|
62 ± 16
|
54 ± 9
|
154
|
|
Potato chips
|
Snack/confectionery
|
52 ± 9
|
61 ± 14
|
91
|
|
Ice cream
|
Snack/confectionery
|
70 ± 19
|
89 ± 13
|
96
|
|
Yogurt
|
Snack/confectionery
|
62 ± 15
|
115 ± 13
|
88
|
|
Mars Bars
|
Snack/confectionery
|
79 ± 13
|
122 ± 15
|
70
|
|
Jellybeans
|
Snack/confectionery
|
118 ± 18
|
160 ± 16
|
118
|
|
Average:
|
Snack/confectionery
|
65 ± 6
|
89 ± 7
|
100
|
|
Doughnuts
|
Bakery product
|
63 ± 12
|
74 ± 9
|
68
|
|
Croissants
|
Bakery product
|
74 ± 9
|
79 ± 14
|
47
|
|
Cake
|
Bakery product
|
56 ± 14
|
82 ± 12
|
65
|
|
Crackers
|
Bakery product
|
118 ± 24
|
87 ± 12
|
127
|
|
Cookies
|
Bakery product
|
74 ± 11
|
92 ± 15
|
120
|
|
Average:
|
Bakery product
|
77 ± 7
|
83 ± 5
|
85
|
|
Food
|
Food Type
|
Glycemic Index score
|
Insulin Index score
|
Satiety score
|
http://en.wikipedia.org/wiki/Insulin_index
Joule
is equal to the energy transferred (work done) when applying a force of one
newton through a distance of one meter.
Many countries use the kg instead of calorie for food energy. One kg = .239 big calories; the
"food
calorie", "large calorie" or kilocalorie (kcal or Cal), equal to 4.184 kilojoules. (Calorie should not be confused with the
small calorie often used in chemistry and physics.)
1.
Rye bread containing 47% kibbled rye,
Holt et al.
2.
Jump
up^ Bread made from whole-meal wheat flour,
Holt et al.
3.
Jump
up^ the authors of the satiety study[3] stated
that the amount of jellybeans consumed tended to make participants nauseated
which may have produced an erroneous satiety score.
Article describing how table
was worked out http://ajcn.nutrition.org/content/66/5/1264.full.pdf
Each portion of food contained 240
Calories—score relative to white bread which was set at 100
|
Peanuts
20
|
|
Fish
59
|
|
Grapes
82
|
|
Eggs
31
|
|
Oranges
69
|
|
Crackers
87
|
|
All
bran 32
|
|
Potato
chips 61
|
|
Ice
cream
89
|
|
Porridge
40
|
|
Brown
rice
62
|
|
Cookies
92
|
|
Brown
Pasta 40
|
|
Special
K
66
|
|
Whole
Bread 96
|
|
White
Pasta 40
|
|
Honey
smacks 67
|
|
White
Bread
100
|
|
Cheese
45
|
|
Coco
Pops
71
|
|
Yogurt
115
|
|
Granola
plain 46
|
|
French
Fries 74
|
|
Baked
Beans
120
|
|
Beef
51
|
|
Corn
Flakes 75
|
|
Potatoes
121
|
|
Popcorn
54
|
|
Croissants 79
|
|
Mars
Bar
122
|
|
Grain
bread 56
|
|
White
Rice 79
|
|
Jelly
Beans
160
|
|
Lentils
58
|
|
Bananas
81
|
|
|
|
Apples
59
|
|
Cake
82
|
|
|
from
http://graemethomasonline.com/wp-content/uploads/2010/06/Insulin-Index.pdf for
article on was developed http://ajcn.nutrition.org/content/66/5/1264.full.pdf
The satiety score
(value) was determined by comparing
how
much food was eaten by participants at a buffet after being fed a fixed number
of calories of a particular food while blindfolded (to ensure food appearance
was not a factor), then dividing that number by the amount eaten by
participants after eating white bread. White bread serves as the baseline of
100. In other words, foods scoring higher than 100 are more satisfying than
white bread and those under 100 are less satisfying.
100 gm portion, free fructose Wiki, for sucrose http://nutritiondata.self.com/tools/nutrient-search
This table is
misleading because sucrose is fructose bound to glucose (thus not free
fructose). Upon passing into the
duodenum, sucrose is hydrolyzed into glucose and fructose, and in those forms
both are absorbed. Thus the amount of
fructose that passes into the liver is the sum of free fructose plus one-half
that of the weight of sucrose, thus we added the 2nd column. The
first column type totals is what is found at Wikipedia for free fructose, a
very misleading figure for available fructose from foods.
Figures 1= free
fructose; figures 2 sucrose, #3 = total fructose (glucose not counted), 100 gm
|
Sugar (sucrose) 0
49
= 49
|
Chocolate
cookies 5.7
|
Tomatoes juice 1.5
|
|
Honey
41
|
Bananas
4.9
|
Peaches
1.5
|
|
Dates
32
|
Pineapple juice 3.8
|
Corn white 1.0
|
|
Raisins
29
|
Watermelon 3.4
|
Lettuce
1.0
|
|
Kellogg raisin
bran 15
|
Red sweet
pepper 2.3
0.0
2.3
|
Carrots
1.0 3.6
4.1
|
|
Peaches dried 13
|
Plum
3.1 1.6
3.9
|
Squash
1.0
|
|
Prunes
12
|
Honeydew 2.9
|
American cheese 0.99
|
|
Grapes
8.1 0,2
8,2
|
Multi grain
bread 2.6
|
Broccoli
0.74
|
|
Grape juice 7.3
|
Strawberry 2.4
|
Sweet potatoes 0.70
2.5 3.0
|
|
Pears
6.2
|
Orange juice 2.4
|
Leaf lettuce 0.40
|
|
Apples pealed 6.0 2.1
7.0
|
Red Pepper
sweet 2.3
|
Cereal
Corn/rice 0.26
|
|
Soda (Coke,
lemon) 5.9
|
Orange navel 1.5
0.8
1.9
|
Peas
0.25
|
|
Apple juice 5.7
|
Gatorade 1.8
|
Nuts
0.13
|
Carbohydrate content of commercial sweeteners (percent
on dry
basis)
|
Sugar
|
Fructose
|
Glucose
|
Sucrose (Fructose-Glucose)
|
Other
sugars
|
|
Granulated
sugar
|
0
|
0
|
100
|
0
|
|
Caramel
|
1
|
1
|
97
|
1
|
|
HFCS-55
|
55
|
41
|
0
|
4
|
|
HFCS-90
|
90
|
5
|
0
|
5
|
|
Honey
|
50
|
44
|
1
|
5
|
|
Molasses
|
23
|
21
|
53
|
3
|
|
Corn syrup
|
0
|
35
|
0
|
0
|
The
path to insulin resistance and type-2 diabetes: Insulin resistance
(IR) is the result of the cells in
a
tissue being significantly less responsive to insulin than the norm, for which
of particular importance is hepatic, adipose and myocyte (muscle) cells. The
cascade of events leading to high insulin starts with fructose.
Fructose damages the liver in 2 ways, one
through glycation. Nearly all of
the
fructose is metabolized in the liver, this entails that the liver accumulates fructose
in the liver and then metabolizes it into fat.
If this fat accumulation occurs faster than clearance, steatosis develops
in the in the vesicles within the hepatic cells. In prolong excess steatosis has a deleterious
effect upon liver functions and become non-alcoholic fatty liver disease (NAFLD) which affects about 30% of the
adult population. NAFLD is strongly associated with IR beyond the liver. One way liver dysfunction promotes IR is through reduced conversion of
glucose to the energy storage form glycogen.
This and for other reasons liver IR
promotes high serum glucose and insulin.
Gradual for those on a high-sugar-carb diet this IR develops in the adipose and myocyte (muscle) cells. IR
in the hepatic, adipose, and myocyte cells causes glucose to remain higher than
normal in the presence of insulin. The
pancreas responds by secreting more insulin which results in hyperinsulinemia
(abnormally high insulin to glucose ratio).
As IR
progresses serum
glucose rises and eventually becomes T2D
as defined by current clinical guidelines.
T2D is can be managed by any
if several classes of drugs which lower serum glucose. Eventually tolerance to the drugs developed
and insulin is added to the treatment with.
For most at some point hyperinsulinemia becomes hypoinsulinemia (low
insulin) as the beta cell function in the pancreas declines.
Another consequence of high serum levels of
glucose and fructose is the development of endothelia dysfunction.
Those endothelia cells that line the artery
walls function as a barrier, their protection decline and this causes an increased
accumulation of bacteria and viruses within the artery wall in the intima
media. The pathogens in the intima
media
cause the inflammation response which results in atherogenesis.
The cascade of event that lead to MeS starts with a prolonged period of
excess consumption of fructose which initiate the cascades toward T2D.
An extremely low carb diet can stop and reverse this process, and if
necessary the addition of alternate day fasting is successful in most
cases.
Carbohydrates,
what’s good,
what’s bad, the worse of carbohydrates is
fructose because 1) of the non-enzymatic
7.5X rate of glycation compared to glucose. However given that the serum level
over two
hours following 75 grams of sucrose is twice that of serum glucose, thus the
amount of glycation compared to glucose is
15X. 2) When in excess to
bodily needs for metabolism,
then in the liver fructose is converted into fats and stored there which leads
to fatty liver disease and poor liver function.
3) Fails to cause satiation upon eating by bypassing the insulin-leptin-Ghrelin
controls of appetite, thus promotes eating in excess of bodily needs. 4) Fructose
like alcohol and opiods affects
the center of the brain which produces addictive behavior.[1] 5) Fructose
through glycation plays a major role in promoting the risk for an assortment of
chronic age-related conditions. 6)
Causes Insulin resistance which thereby accelerates through high blood sugar
glycation. 7) Glycation damages LDL thus
causing CVD, atherosclerosis, and ischemic events throughout out the body
as a result of leaked plaque such as strokes, heart attacks, and kidney
disease. 9) The damage to proteins
throughout the body by glycation is associated with an increased risk for Alzheimer’s
& Parkinson’s diseases, gout, macular degeneration, arthritis, obesity,
diabetes, insulin resistance, and others conditions. The main source of fructose
is the
disaccharide sucrose (glucose and fructose) followed by fruits and high
fructose corn sweeteners. Too large an amount
of sugars in a meal or snack overloads the body’s system for handling glucose
and fructose. The degree of overload is affected
by the rate of absorption and physical activity, both prior and subsequent to
the meal. Exertion
promotes the utilization of
glucose and fructose and thus reduces the insulin spike and glycation—also Wiki.
By default starches
are preferred source of carbohydrates—they lack fructose. Smaller portions
of starches and meals high in
protein, fats, and bulk (foods such as eggs, fish, peanut butter, and
vegetables) reduces the glucose-fructose overload from carbohydrates by slowing
absorption. When plotting out a
healthful diet, age, physical activity, insulin response, muscle mass, obesity,
and condition of the liver must be considered as to effect of starch and sugars
upon health. Fruits make an ideal
desert because of the fiber and low
carbohydrate content per normal size portion.
In Part 4 the role of fats in CVD
is discussed, and there it is shown that saturated fats are the preferred
sources for the production of ATP. When
weight is a concern, weight loss is promoted by a low carbohydrate diet with
increase in vegetables, protein sources and saturated fats. “If insulin is elevated there is a net inward flux of FFA, and
only when insulin is low can FFA leave adipose tissue. Insulin secretion is
stimulated by high blood sugar, which results from consuming carbohydrates” Wiki In Part 5 on reducing CVD
risk, questions about diet are further developed, and in Part 8.is the question of obesity dealt
with directly in most of
its complexities.
[1]
“Sugar is noteworthy as a substance that releases opioids and
dopamine and thus might be expected to have addictive potential. Sugar is
noteworthy as a substance that releases opioids and dopamine and thus might be
expected to have addictive potential.
This may translate to some human conditions as suggested by the
literature on eating disorders and obesity” long. also
|
|
|
|
|
|
|
|
|
|
|
|
Enter supporting content here
INTERNAL SITE SEARCH ENGINE by Google
|
|
|
|
|